Today in Energy
Recent Today in Energy analysis of natural gas markets is available on the EIA website.
Market Highlights:
(For the week ending Wednesday, December 3, 2025)Prices
- Henry Hub spot price: The Henry Hub spot price rose 28 cents from $4.59 per million British thermal units (MMBtu) last Wednesday to $4.87/MMBtu yesterday. Most U.S. trading hubs reflected spot prices ranging from $4/MMBtu to $5/MMBtu as of yesterday.
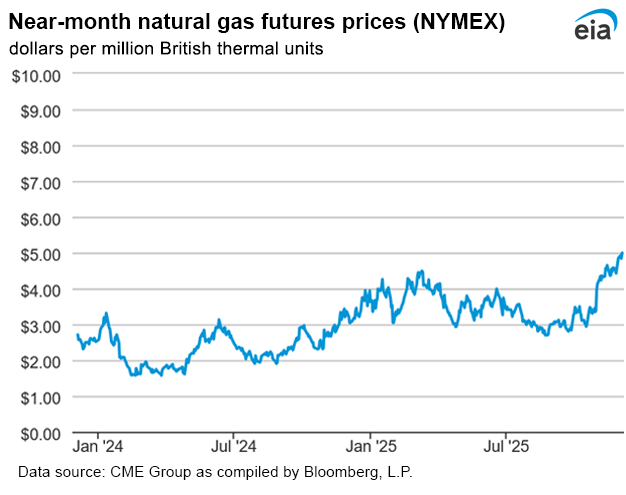
- Henry Hub futures price: The December 2025 NYMEX contract expired November 25 at $4.424/MMBtu, down 13 cents from Wednesday, November 19. The price of the January 2026 NYMEX contract increased 44 cents, from $4.558/MMBtu last Wednesday to $4.995/MMBtu yesterday. Near-month futures prices are at their highest since December 2022. The price of the 12-month futures contract strip averaging January 2026 through December 2026 climbed 26 cents to $4.302/MMBtu.
- Select regional spot prices: Natural gas spot prices rose at most locations this report week (Wednesday, November 26 to Wednesday, December 3), ranging from a decrease of 10 cents at Northwest Sumas to an increase of $16.92 at the Algonquin Citygate.
- Spot natural gas prices in the Northeast surged last week, driven by colder weather across much of the United States. The Algonquin Citygate, which serves the Boston area, had a significant price increase. It rose from $8.08/MMBtu last Wednesday to $25.00/MMBtu yesterday, marking a $16.92 rise, which is the highest recorded for the Algonquin Citygate since January 2025. Historically, this hub has some of North America's highest natural gas spot prices in winter due to regional pipeline capacity constraints that affect New England’s combined space heating and electricity demands. Temperatures in the Boston Area steadily declined during the week, averaging 35°F yesterday and 38°F for the report week, resulting in 32 more heating degree days (HDDs) than the previous week. The Algonquin Gas Transmission pipeline implemented flow restrictions at certain locations from Monday through Wednesday to ensure customer volumes would align with approved scheduled capacity. In response to colder-than-normal temperatures and increased natural gas needs for space heating, New England boosted electricity imports, increased oil-fired generation, and imported regasified liquefied natural gas (LNG) from the Canaport LNG terminal. Overall, natural gas consumption in the Northeast climbed by 25% (3.3 billion cubic feet per day [Bcf/d]), primarily due to a 2.7 Bcf/d increase in residential and commercial heating demand, according to LSEG Data. Furthermore, natural gas consumption in the electric power sector grew by 8% (0.5 Bcf/d) to accommodate heightened electric heating needs. The Northeast recorded 744 HDDs, which is 55 more than normal and 81 more than the prior report week.
- International futures prices: International natural gas futures prices decreased this report week. According to Bloomberg Finance, L.P., weekly average front-month futures prices for liquefied natural gas (LNG) cargoes in East Asia decreased 30 cents to a weekly average of $11.04/MMBtu. Natural gas futures for delivery at the Title Transfer Facility (TTF) in the Netherlands decreased 49 cents to a weekly average of $9.66/MMBtu. In the same week last year (week ending December 4, 2024), the prices were $15.06/MMBtu in East Asia and $14.82/MMBtu at TTF. Top
Daily spot prices by region are available on the EIA website.
Liquefied Natural Gas (LNG)
- Vessels departing U.S. ports: Thirty-seven LNG vessels with a combined LNG-carrying capacity of 138 billion cubic feet (Bcf) departed the United States between November 27 and December 3, according to shipping data provided by Bloomberg Finance, L.P.:
- Nine tankers from Sabine Pass
- Eight from Plaquemines
- Six from Corpus Christi
- Five each from Cameron and Freeport
- Three from Calcasieu Pass
- One from Cove Point
Rig Count
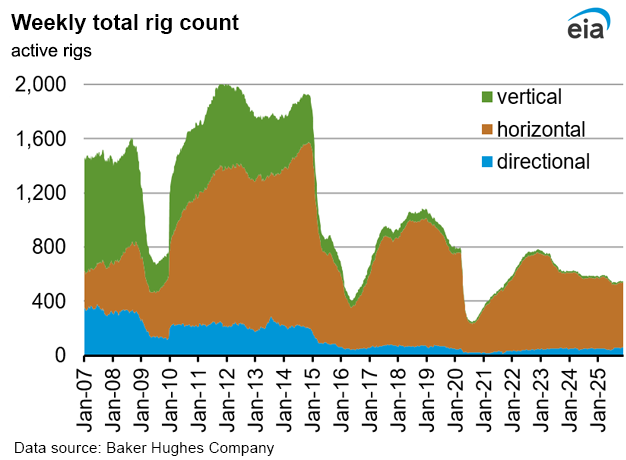
- According to Baker Hughes, for the week ending Tuesday, November 25, the natural gas rig count increased by 3 rigs from a week ago to 130 rigs. The Arkoma Woodford added two rigs and one rig was added for unidentified producing regions. The number of oil-directed wells decreased by 12 rigs from a week ago to 407 rigs. The Permian dropped three rigs, the Granite Wash, the Eagle Ford, and the Arkoma Woodford each dropped two rigs, and four rigs were dropped among unidentified producing regions. The Cana Woodford added one rig. The total rig count, which includes 7 miscellaneous rigs, now stands at 544 rigs, 38 fewer than at this time last year.
Storage
- Net withdrawals from storage totaled 12 Bcf for the week ending November 28, compared with the five-year (2020–24) average net withdrawals of 43 Bcf and last year's net withdrawals of 26 Bcf during the same week. Working natural gas stocks totaled 3,923 Bcf, which is 191 Bcf (5%) more than the five-year average and 18 Bcf (less than 1%) lower than last year at this time.
See also:
Top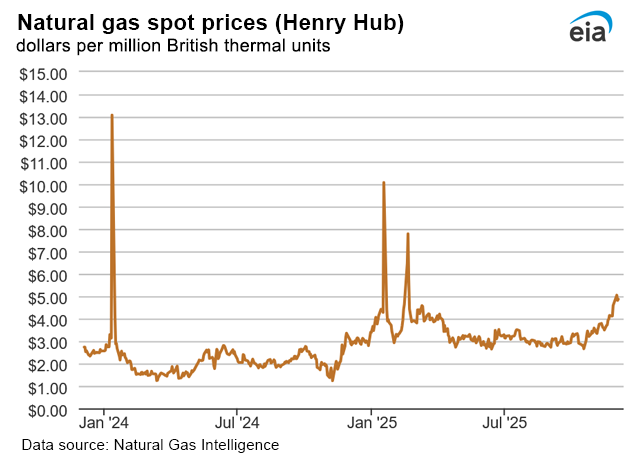
| Spot Prices ($/MMBtu) | Thu, 27-Nov |
Fri, 28-Nov |
Mon, 1-Dec |
Tue, 2-Dec |
Wed, 3-Dec |
|---|---|---|---|---|---|
| Henry Hub | Holiday | Holiday | 5.05 | 4.81 | 4.87 |
| New York | Holiday | Holiday | 5.38 | 5.37 | 6.02 |
| Chicago | Holiday | Holiday | 4.49 | 4.37 | 4.78 |
| Cal. Comp. Avg,* | Holiday | Holiday | 4.50 | 4.28 | 4.47 |
| *Avg. of NGI's reported prices for: Malin, PG&E Citygate, and Southern California Border Avg. | |||||
| Data source: NGI's Daily Gas Price Index | |||||
| Spot Prices ($/MMBtu) | Thu, 20-Nov |
Fri, 21-Nov |
Mon, 24-Nov |
Tue, 25-Nov |
Wed, 26-Nov |
|---|---|---|---|---|---|
| Henry Hub | 2.83 | 2.42 | 2.77 | 3.16 | 3.35 |
| New York | 2.69 | 2.52 | 2.86 | 3.21 | 3.68 |
| Chicago | 2.71 | 2.38 | 2.76 | 3.11 | 2.92 |
| Cal. Comp. Avg,* | 3.60 | 3.36 | 3.52 | 3.18 | 3.45 |
| *Avg. of NGI's reported prices for: Malin, PG&E Citygate, and Southern California Border Avg. | |||||
| Data source: NGI's Daily Gas Price Index | |||||
| Rigs | |||
|---|---|---|---|
Tue, November 25, 2025 |
Change from |
||
|
last week
|
last year
|
||
| Oil rigs |
407
|
-2.9%
|
-14.7%
|
| Natural gas rigs |
130
|
2.4%
|
30.0%
|
| Note: Excludes any miscellaneous rigs | |||
| Rig numbers by type | |||
|---|---|---|---|
Tue, November 25, 2025 |
Change from |
||
|
last week
|
last year
|
||
| Vertical |
11
|
-8.3%
|
-31.3%
|
| Horizontal |
475
|
-1.2%
|
-8.8%
|
| Directional |
58
|
-4.9%
|
28.9%
|
| Data source: Baker Hughes Company |
|||
| Working gas in underground storage | ||||
|---|---|---|---|---|
Stocks billion cubic feet (Bcf) |
||||
| Region |
2025-11-28 |
2025-11-21 |
change |
|
| East |
888 |
892 |
-4 |
|
| Midwest |
1,088 |
1,103 |
-15 |
|
| Mountain |
288 |
292 |
-4 |
|
| Pacific |
315 |
319 |
-4 |
|
| South Central |
1,345 |
1,329 |
16 |
|
| Total |
3,923 |
3,935 |
-12 |
|
|
Data source: U.S. Energy Information Administration Form EIA-912, Weekly Underground Natural Gas Storage Report Note: Totals may not equal sum of components because of independent rounding. | ||||
| Working gas in underground storage | |||||
|---|---|---|---|---|---|
Historical comparisons |
|||||
Year ago 11/28/24 |
5-year average 2020-2024 |
||||
| Region | Stocks (Bcf) |
% change |
Stocks (Bcf) |
% change |
|
| East |
916 |
-3.1 |
888 |
0.0 |
|
| Midwest |
1,118 |
-2.7 |
1,080 |
0.7 |
|
| Mountain |
289 |
-0.3 |
236 |
22.0 |
|
| Pacific |
310 |
1.6 |
281 |
12.1 |
|
| South Central | 1,309 |
2.8 |
1,248 |
7.8 |
|
| Total | 3,941 |
-0.5 |
3,732 |
5.1 |
|
| Data source: U.S. Energy Information Administration Form EIA-912, Weekly Underground Natural Gas Storage Report
Note: Totals may not equal sum of components because of independent rounding. |
|||||
| Temperature – heating & cooling degree days (week ending Nov 27) | ||||||||
|---|---|---|---|---|---|---|---|---|
HDDs |
CDDs |
|||||||
| Region | Current total |
Deviation from normal |
Deviation from last year |
Current total |
Deviation from normal |
Deviation from last year |
||
| New England | 185 |
1 |
24 |
0 |
0 |
0 |
||
| Middle Atlantic | 155 |
-19 |
5 |
0 |
0 |
0 |
||
| E N Central | 176 |
-25 |
4 |
0 |
0 |
0 |
||
| W N Central | 177 |
-49 |
-26 |
0 |
0 |
0 |
||
| South Atlantic | 80 |
-39 |
-30 |
14 |
3 |
9 |
||
| E S Central | 77 |
-47 |
-37 |
2 |
1 |
2 |
||
| W S Central | 48 |
-40 |
-23 |
15 |
11 |
12 |
||
| Mountain | 167 |
-28 |
-3 |
0 |
0 |
0 |
||
| Pacific | 85 |
-15 |
-13 |
0 |
-1 |
0 |
||
| United States | 130 |
-28 |
-9 |
4 |
2 |
3 |
||
|
Data source: National Oceanic and Atmospheric Administration Note: HDDs=heating degree days; CDDs=cooling degree days | ||||||||
Average temperature (°F)
7-day mean ending Nov 27, 2025
Data source: National Oceanic and Atmospheric Administration
Deviation between average and normal temperature (°F)
7-day mean ending Nov 27, 2025
Data source: National Oceanic and Atmospheric Administration
Monthly U.S. dry shale natural gas production by formation is available in the
Short-Term Energy Outlook.