Refining and Marketing
U.S. Refining/Marketing
The average profitability (contribution to net income divided by net investment in place or return on investment (ROI)) of U.S. refining/marketing operations of the respondents to the Financial Reporting System (FRS) survey was negative 7 percent in 2009 (Figure 18), the lowest in the 33-year history of the FRS.
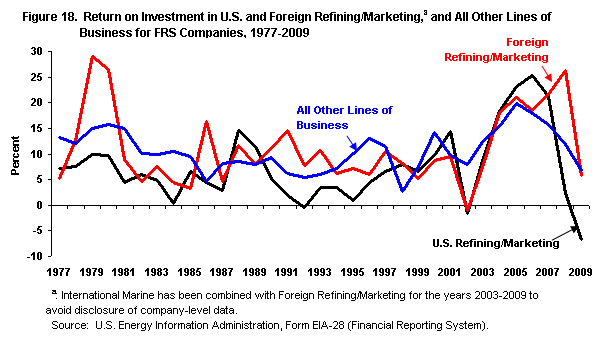
figure data
Further, because the loss of 2009 almost immediately followed an unusually profitable 5-year period (2004 through 2008) that included the 4 highest returns in the history of the FRS, the perception of the loss may be magnified.
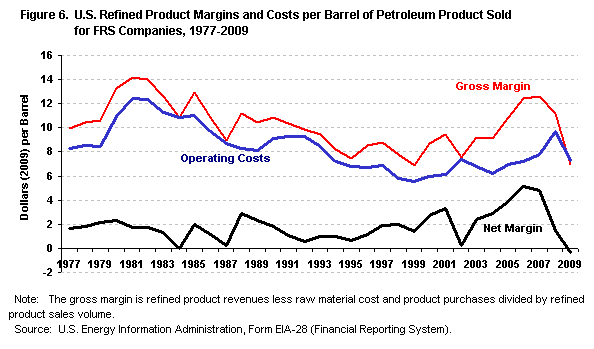
figure data
Changes in the profitability of the FRS companies generally happen for two reasons: differences in the rate of change of FRS 21 product prices relative to the rate of change of the crude oil price; and changes in operating costs. Reductions in operating costs due to successful cost-cutting efforts during the 1990s and early 2000s led to increased profitability during that period (see Figure 6 in the "Financial Developments" section). Subsequently, product prices grew faster than crude oil prices during 2004-2008, 22 leading to a period of unusually high profitability. Relative to 2008, 2009 product prices fell by more than did crude oil prices, resulting in lower profitability. Concurrent reductions in operating costs (Table 13) were insufficient to prevent the largest loss in the history of the FRS. 23
The net refined product margin (net margin) strongly correlates with profitability. 24 Examination of the components of the net margin usually illuminates the underlying reasons for changes in the profitability of U.S. refining/marketing operations. The net margin is the gross margin 25 minus operating costs per barrel of refined product sold. The negative $0.36-per-barrel net margin of 2009 was the lowest (in terms of 2009 dollars) 26 in the 33-year history of the FRS (see Figure 6, at left) and the only time that a negative net margin occurred.
The average gross refining margin reported by the FRS companies in 2009 fell 38 percent compared with 2008 (Table 13). The average price received for petroleum products in 2009 decreased almost $41 per barrel relative to the 2008 value, while raw materials and purchased product costs fell almost than $37 per barrel to $62.46. These changes resulted in a $4.27-per-barrel decrease in the gross refining margin to $6.95. Further, the gross margin of 2009 was almost the lowest in the history of the FRS, exceeding only 1999's $6.91 gross margin.
Revenues and Costs
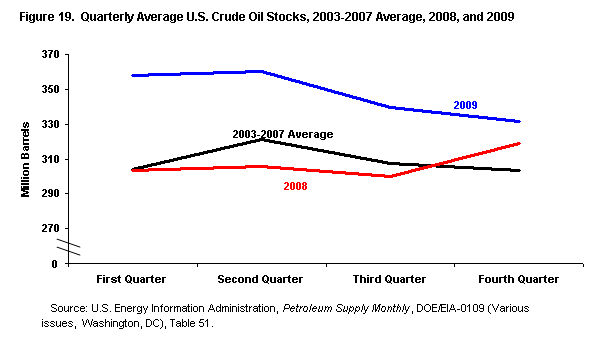
figure data
Industry-wide U.S. crude oil stock levels were higher in 2009, especially early in the year, than both 2008 and the average for 2003-2007 (Figure 19). This put downward pressure on industry-wide crude oil prices. During most of 2009 industry-wide crude oil prices were lower than in 2008 and resulted in a 37-percent lower average price. 27 These changes contributed to the 36-percent decrease in FRS raw material and purchased product costs for 2009 relative to 2008 (Table 13). 28
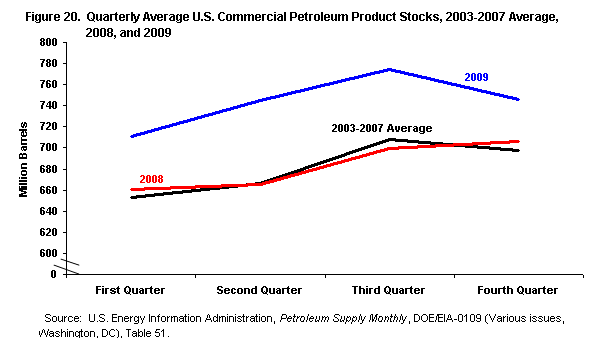
figure data
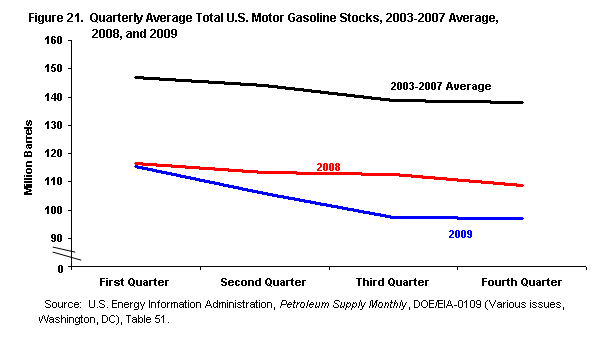
figure data
Petroleum product prices tend to move with crude oil prices, both of which fell in 2009 (compared with 2008). Additionally, industry-wide stocks of petroleum products were higher in 2009 than in 2008 (and the average over 2003-2007) throughout the year (Figure 20). Although relatively high petroleum product stocks levels put downward pressure on product prices in general, total motor gasoline 29 stock levels were essentially unchanged in 2009 relative to 2008 (or the average over 2003-2007) (Figure 21) and exerted little pressure on motor gasoline prices.
FRS petroleum product sales increased 1 percent in 2009 relative to 2008 (Table 13), largely because of the addition of Alon, Chalmette, and Western Refining 30 to the FRS group, against an industry backdrop of a 4-percent decline in product sales. 31 Product sales are composed chiefly of motor gasoline and distillate. Gasoline sales increased 4 percent while distillate sales decreased slightly more than 1 percent. Sales of all other petroleum products declined 2 percent in 2009 relative to 2008 (Table 14). Negligibly higher sales and much lower average petroleum product prices reduced domestic petroleum product sales revenues by $298 billion (Table 15). Meanwhile, operating costs fell by $284 billion, resulting in a decline in operating income of more than $18 billion (including the decline in other revenue). Comparing 2009 with 2008, the changes in revenues and costs resulted in an operating loss of more than $12 billion and a net loss (including special items) of more than $9 billion in 2009.
Those operating expenses most closely associated with refining and marketing operations decreased by 25 percent on a per-barrel basis between 2008 and 2009 (Table 13), led by decreases in refining energy costs and other operating costs (Table 14).
Energy costs decreased by $1.20 to $1.32 per barrel, 32 their lowest level since 2002 and one of the lowest levels ever reported in the history of the FRS. 33 Average wellhead natural gas prices fell $4.46, from $8.18 in 2008 to $3.72 per thousand cubic feet 34 in 2009, accounting for some of the decrease. Lower energy costs also could be attributed to factors such as lower utility costs, 35 lower fuel costs, 36 and a full year of benefits from cost-reductions implemented during 2008. 37 FRS companies continue to implement changes aimed at the containment of energy costs, but it appears that one of the major efforts over the last 10 years, U.S. cogeneration projects, have finally been completed. 38
Other operating costs related to refining decreased from $5.45 per barrel in 2008 to $4.52 per barrel in 2009 (Table 14). Operating costs associated with compliance with the Clean Air Act Amendments of 1990 were mixed in 2009 relative to 2008, increasing for some companies and falling for others. 39
Additional reasons that other operating costs fell in 2009 include reduced negotiated prices for materials, labor, and services; 40 reduced waste water-treatment costs due to recently introduced technology; 41 lower turnaround costs, 42 and an absence of hurricane-related charges. 43 Meanwhile, impairment write-downs were another major reason for higher costs. 44
Operational Changes
The FRS companies refocused their marketing operations for the last several years, culminating in the lowest outlet total in the history of the FRS in 2009. Historically, this was accomplished by making selective investment in some outlets, 45 acquiring some outlets, 46 and divesting others, 47 which also was true of 2009. However, the last two years have brought unusually large changes as BP, 48 ConocoPhillips, Exxon Mobil, three of the largest FRS respondents, began exiting motor gasoline retailing rather than merely "refocusing" their operations as had been the case. 49 The FRS companies' continued reduction in their direct-supplied outlets may demonstrate their confidence that the low returns of 2008 and 2009, not the high returns of 2004-2007, from their U.S. refining/marketing operations will persist.
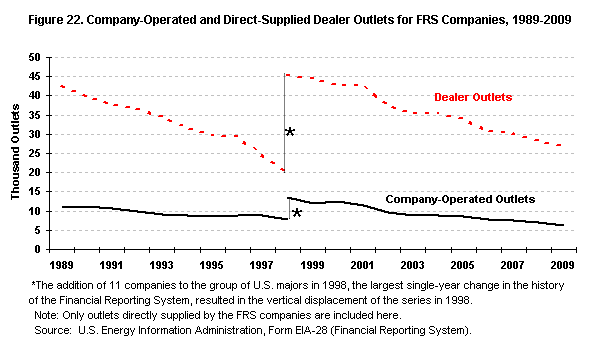
figure data
Marketing costs fell $0.29 per barrel in 2009 relative to 2008 50 Table 14 as FRS direct-supplied 51 motor gasoline outlets were reduced 6 percent in 2009 Table 16), continuing a long-time trend (Figure 22). Companies' marketing costs decreased as they shifted sales of motor gasoline from higher-cost channels of distribution, company-operated outlets and dealer outlets, to lower-cost channels of distribution, wholesale and direct sales.
The number of company-operated outlets fell 11 percent while dealer outlets fell 5 percent 52 during 2009 (Table 16) against an industry backdrop of a small increase in U.S. motor gasoline outlets. 53 The overall effect was a reduction of 2,153 direct-supplied FRS branded outlets during 2009 and a small decline in the FRS share of total U.S. outlets from 22 percent at year-end 2008 to 20 percent at year-end 2009.
Marginal outlets ideally would be the first divested, which would tend to increase average productivity of the remaining outlets, 54 measured by average monthly motor gasoline sales volume. Dealer productivity increased 5 percent between 2008 and 2009. However, productivity of company-operated outlets fell 4 percent, 55 which may indicate the FRS companies' strategy to exit this part of their marketing operations, regardless of its effect on per-outlet productivity. 56
Meanwhile, refinery capacity reported by the FRS companies increased by 2 percent (Table 17), primarily because of the addition of the joint venture Chalmette (Exxon Mobil and Petroleos de Venezuela, S.A.), Alon USA, and Western Refining. The addition of their total capacity of 649,900 barrels per day 57 (bpd) more than offset the reduction of capacity of 412,200 bpd from the shutdown of two refineries and the sale of another. In June 2009, Sunoco both permanently shut down its 145,000 barrel-per-day Westville, New Jersey (Eagle Point), refinery in June 2009 and sold its 85,000 barrels-per-day Tulsa, Oklahoma, refinery to Holly Corporation. 58 Additionally, Valero shut down its 182,200-barrels-per-day Delaware City, Delaware, refinery in November 2009. 59
Increased ability to process heavier and/or higher sulfur crude oil 60 and further environmental investments, 61 including those related to ethanol, 62 were among the major motivations for the refinery investments of 2009. The combination of transactions and marginal upgrades resulted in a 1-percent increase in U.S. refining additions to net investment in place (Table 17). Although the increase in addition to net investment in place was modest, it resulted in 2009 supplanting 2008 as the year of the greatest investment in U.S. refining by the FRS companies in the history of the FRS. 63
For the last several years the relatively complex FRS refineries (Table 18) provided cost savings by taking advantage of price differences between the relatively lower-cost heavy crude oils and the relatively higher-cost light crude oils because the refineries can refine a wide range of crude oils. Further, revenues were increased marginally because complex refineries can produce relatively more higher-priced, light products. However, the circumstances of 2009 diminished both advantages of refining complexity.
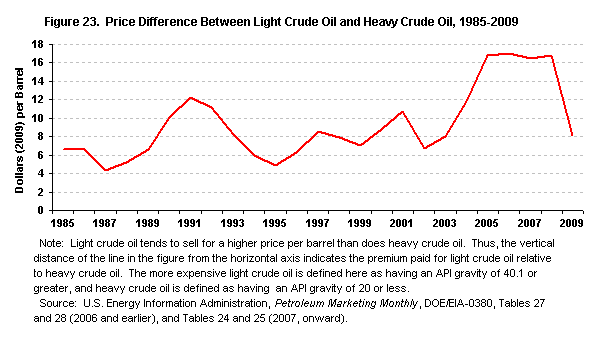
figure data
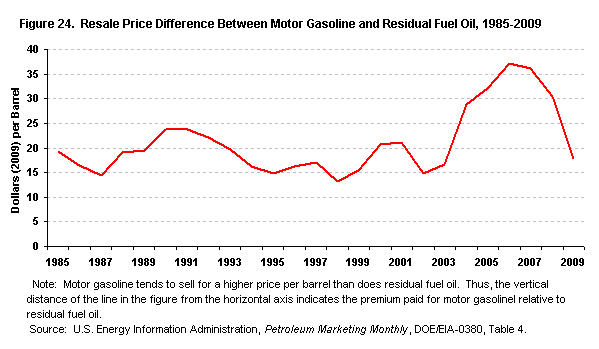
figure data
The difference between the prices of light crude oil and heavy crude decreased substantially (Figure 23) as the discount paid for heavy crude oil fell from $16.65 per barrel in 2008 to $8.13 per barrel in 2009. Further, the difference between the price of lighter products (represented by the price of motor gasoline) and the price of heavier products (represented by the price of residual fuel oil) decreased between 2008 and 2009 (Figure 24), falling $12.67 per barrel. These changes put upward pressure on raw materials costs and downward pressure on product revenues. Thus, despite reductions in all crude oil and product prices in 2009, the decline in FRS costs of raw materials and product purchases ($36.51 per barrel) was smaller than the decline in FRS product revenues ($40.79 per barrel) (Table 13), diminishing the bottom line of the FRS U.S. refining/marketing operations.
The year 2009 not only was the least profitable for U.S. refining/marketing operations in the 33-year history of the FRS, but it seemed all the more so by following the three most profitable years in the history of the FRS so closely. The primary reason for the decreased profitability of the FRS U.S. refining/marketing operations in 2009 relative to 2008 was a reduced gross refining margin (i.e., average annual petroleum product prices increased by less than average annual raw materials costs), which was somewhat offset by lower operating costs for all categories of cost - marketing, energy costs, and "other" operating costs. The combination of these changes resulted in a decline in the net refining margin from $1.49 in 2008 to a loss of $0.36 per barrel, the only negative net margin in the 33-year history of the survey. Falling revenues and earnings provided incentives for FRS companies to realign their U.S. refining/marketing operations. The long-time divestiture of their motor gasoline retailing assets continued in 2009. Upgrading of refinery capacity also continued in 2009, further expanding their ability to refine the lowest quality (and lowest cost) crude oils available and produce more highly-valued products. Despite these cost reduction and revenue maximization efforts, the FRS companies experienced the worst year in survey's history. However, early returns suggest that these efforts will be more successful in 2010.
Foreign Refining/Marketing 65
figure data
Somewhat similar to their 2009 domestic refining/marketing performance, the FRS companies reported the eighth-lowest profitability for their foreign refining/marketing operations in the history of the FRS. The profitability of 2009 was 6 percent, slightly more than 20 percentage points below 2008's rate, which was the third-highest in FRS history (Figure 18). The combination of refined product and other revenue decreased by $136.1 billion relative to 2008, which exceeded the $124.9-billion decrease in operating expense and resulted in an $11.2-billion decrease (-75 percent) in operating income and an $8.6-billion decrease (-77 percent) in net income (Table 15).
The FRS companies derive their foreign refining/marketing earnings from two sources: consolidated operations and unconsolidated affiliates. A fully consolidated affiliate is directly controlled by the parent corporation (although it could be owned by several companies, with the parent corporation retaining control). In addition, public financial disclosures of the parent corporation include all operating financial information about a fully consolidated affiliate (such as revenues). Conversely, the corporate parent of an unconsolidated affiliate usually owns 50 percent or less of the affiliate, and does not directly control the affiliate 66 (a joint venture, for example, is usually an unconsolidated affiliate from the perspective of at least one of the partners). Essentially, the unconsolidated affiliate is more of a property or holding of the parent corporation than a company that the parent actually operates. The effect on financial operations of an unconsolidated affiliate can be seen only on the parent corporation's income statement, on which the parent company reports its proportional share of the affiliate's net income.
Historically, approximately half of the FRS consolidated foreign refinery capacity is located in Europe, reaching 54 percent in 2009 (Table 19), with most of the remaining consolidated refinery capacity in Asia. Historically and at present the operations of the FRS companies' unconsolidated foreign refining/marketing affiliates overwhelmingly are in Asia, with Chevron the primary owner of unconsolidated FRS Asian refinery capacity.
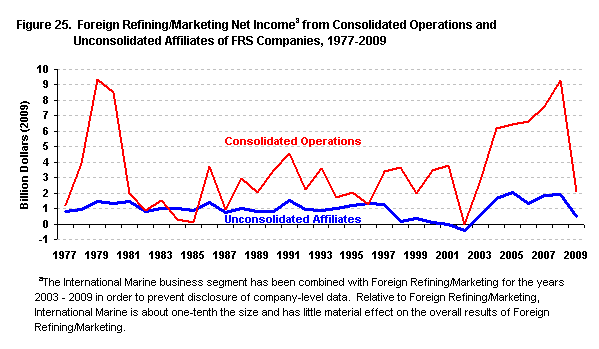
figure data
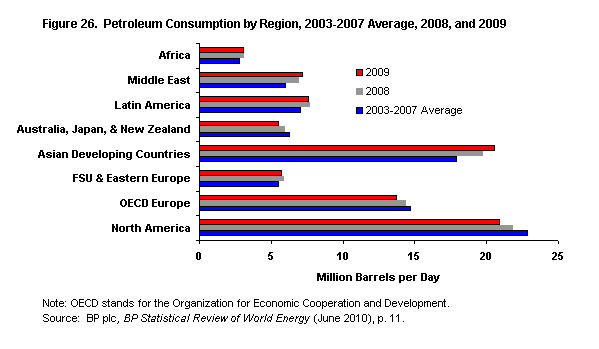
figure data
Reduced net income in 2009, relative to 2008, from FRS foreign refining/marketing operations was because of decreased income from both consolidated and unconsolidated operations (Figure 25). Worldwide petroleum demand fell slightly in 2009, primarily due to lower North American and OECD Europe consumption (Figure 26), putting downward pressure on prices and revenues. Further, companies reported reduced revenues due to lower product sales, 67 leading to additional downward pressure on their revenues and bottom line. Additional reasons for reduced earnings from both FRS consolidated and FRS unconsolidated operations noted in public statements included foreign currency losses, 68 an absence of trading gains, 69 decreased refining and marketing margins, 70 capital expenditures to produce clean fuels, 71 lower sales, and lower refinery utilization rates 72 (Table 16). However, the companies also undertook several actions aimed at improving future profitability - increasing ability to process lower-cost crude oil, 73 and divestitures of refinery 74 and other assets. 75
Consolidated Operations
Much lower earnings from consolidated FRS foreign refining/marketing operations occurred within an industry environment of lower (Figure 26) European petroleum demand, which fell 4 percent (0.6 million barrels per day) compared with 2008 and 9 percent (1.0 million barrels per day) relative to the 2003-2007 average. Earnings from the FRS companies' consolidated operations decreased (Figure 25) more than $7.1 billion (77 percent) between 2008 and 2009, providing $2.1 billion of net income. Historically, 2009 is in the lower half of all-time FRS consolidated results, the lowest level since 2002's loss of $37 million, and one year after the second-highest 76 FRS result ever.
The FRS consolidated operations generated lower earnings due to lower prices received, lower margins, and reduced sales. 77 However, they attempted to increase future profitability by adding cogeneration capacity, 78 making refinery upgrades, 79 and divesting non-core marketing outlets. 80
Unconsolidated Operations
During 2009, the FRS companies' unconsolidated affiliates generated $0.5 billion of net income, which was 76 percent lower than 2008. Lower earnings occurred despite increased product demand in all of Asia/Pacific, both relative to 2008 and to the 2003-2007 average. However, changes in petroleum product consumption in Asia were varied (Figure 26). Consumption by the Asian Developing Countries rose 4 percent (0.8 million barrels per day) relative to 2008 and 14 percent (2.6 million barrels per day) relative to the 2003-2007 average. However, consumption in the developed Asian countries of Australia, Japan, and New Zealand collectively fell 8 percent (0.5 million barrels per day) relative to 2008 and 13 percent relative to the 2003-2007 average (0.8 million barrels per day). The higher petroleum consumption level in all of Asia/Pacific was insufficient to prevent a decline in FRS earnings from their unconsolidated foreign refining/marketing operations, which fell to $461 million -- the lowest level since 2002, the sixth-lowest in FRS history, and a mere 4 years removed from the all-time high of 2005.
Company public disclosures included some reasons for the lower earnings generated by the Asian (and other unconsolidated) operations of the FRS companies, which included declines in foreign exchange rates, 81 lower prices, and lower margins. 82 Future revenue-enhancing efforts made during 2009 include increasing refinery capability to refine lower-quality crude and produce ultra-low sulfur products, 83 adding refinery and cogeneration capacity, 84 revising refining upgrade schedules, 85 and refocusing marketing operations. 86
FRS companies' foreign refining/marketing earnings decreased substantially in an industry setting of lower worldwide petroleum product consumption, particularly in Europe and the more developed Asia/Pacific countries of Japan, Australia, and New Zealand. Foreign exchange declines, lower product prices, margins, and sales all contributed to the much lower profitability of the FRS companies' foreign refining/marketing operations in 2009. Thus, long-term strategies to maximize revenues and minimize costs remain important, if not more so. Cost-cutting measures, such as increasing cogeneration capacity 87 and strategic divestment, 88 likely will continue to occupy prominent positions in the companies' ongoing strategic actions.