Overview of 2009 Petroleum and Natural Gas Markets
- Crude oil, natural gas, and petroleum products prices all fell sharply in 2009 from the record high prices in all three categories for 2008. On an average annual basis, crude oil prices dropped 37 percent from 2008 (in constant 2009 dollars), and natural gas wellhead prices dropped 54 percent to $3.71 per thousand cubic feet (mcf) in 2009.
- Within-year price movements, however, amend the story told by average annual prices: oil prices fell in the second half of 2008, and it was only because price increases in the first part of the year were so large that the average annual price reached a record high in 2008. From the relative low of December 2008, oil prices increased most months of 2009 to a level of $72.64 per barrel in December 2009, over twice the level of December 2008.
- The prices of each of the major petroleum products dropped sharply from their record highs of 2008: gasoline by 32 percent, distillate by 43 percent, and jet fuel by 44 percent.
- World oil demand decreased 1.7 percent, or 1.4 million barrels per day (mmbd), from the 2008 level to 84.3 mmbd in 2009.
- Worldwide reserve additions replaced 102 percent of crude oil and natural gas liquids (NGL) production in 2009.
- U.S. petroleum product demand dropped 3.7 percent in 2009 to 18.8 mmbd (Table 22), following 2008's decline of 5.7 percent.
- U.S. natural gas demand decreased 1.8 percent in 2009 to 22.8 trillion cubic feet, while domestic natural gas production increased 3.3 percent, following the 7.7 percent increase in 2008. U.S. natural gas reserves increased to their highest level since the U.S. Energy Information Administration began reporting them in 1977.
The market overview section provides a brief review of prices, demand, and supply for petroleum and natural gas markets to give an indication of the general market conditions in which FRS companies operated in 2009.
The FRS companies' financial results for 2009 were driven primarily by sharp drops in the annual average prices of crude oil, petroleum products and natural gas, coupled with declines in consumption of oil and natural gas. Crude oil prices (imported refiner acquisition cost) dropped 37 percent in 2009 from the all-time high of $93.62 per barrel in 2008 (in constant 2009 dollars), 102 while natural gas wellhead prices decreased 54 percent to $3.71 per thousand cubic feet (mcf) in 2009. 103 World oil consumption declined for the second straight year (1.7 percent in 2009, 0.6 percent in 2008), following twenty-four consecutive years of increases. 104 The decline in petroleum consumption was sharper in the United States, with a drop of 3.7 percent in 2009 following the drop of 5.7 percent in 2008. 105 U.S. natural gas consumption also declined in 2009, by 1.8 percent. 106
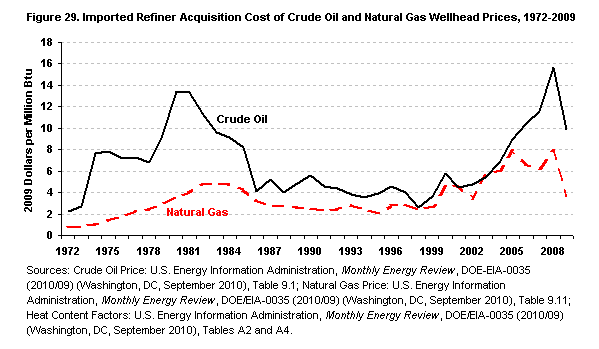
figure data
Since 1998, crude oil prices have increased by nearly a factor of four and natural gas prices by almost one-and-one-half times (Figure 29). These changes have steadily widened the gap between crude oil and natural gas prices on a million British thermal unit basis over the 2006-2009 period, compared to relatively narrow gaps for most of the decade before that (Figure 29).
Annual average prices, however, do not tell the whole story of price movements in 2009 (or 2008). Though oil prices averaged over the year reached a record high in 2008, they fell substantially in the second half of the year reaching a low of $35.72 per barrel in December 2008. From that relative low, oil prices increased most months of 2009 relative to the prior (not year-ago) month, to a level of $72.64 per barrel in December 2009, over twice the level of December 2008. So oil prices averaged over the year decreased sharply while year-end price levels increased sharply. For natural gas, the price decline from 2008 to 2009 for year-end levels of 20 percent was a milder decline than the 54 percent drop in the annual average.
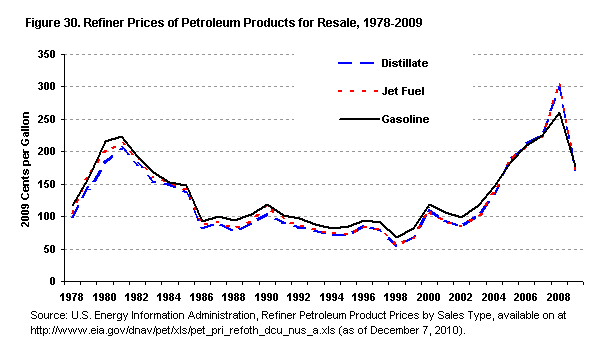
figure data
Gasoline, distillate, and jet fuel prices decreased 32 percent, 43 percent, and 44 percent, respectively, in 2009, after two successive years of the highest prices since the Energy Information Administration (EIA) began reporting product prices in 1978 (Figure 30). The 2009 price averages of the three fuels in 2009 were tightly bunched between $1.71 and $1.77 per gallon. By comparison, crude oil prices decreased 37 percent.
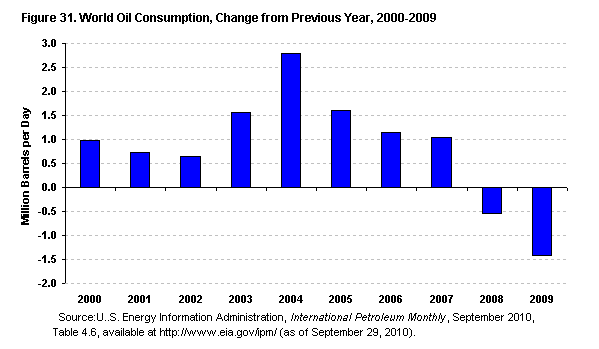
figure data
World oil demand decreased 1.4 million barrels per day (mmbd) (1.7 percent) from the 2008 level to 84.3 mmbd in 2009 (Table 21). Demand growth had slowed considerably since the large increase in 2004 (Figure 31), but consecutive declines in 2008 and 2009 were the only decreases in world demand since 1983. Supply, which includes the production of crude oil, natural gas liquids (NGLs) and other liquids, and refinery processing gain, decreased 1.1 mmbd (1.3 percent) in 2009 to 84.4 mmbd. The decline in demand exceeded the decline in supply by enough to put demand just below supply. This led to a small increase in petroleum inventories of about 40,000 barrels per day in 2009. Worldwide reserve additions replaced 102 percent of crude oil and NGL production in 2009. 107 The reserve replacement rate for non-Organization of the Petroleum Exporting Countries was 101 percent.
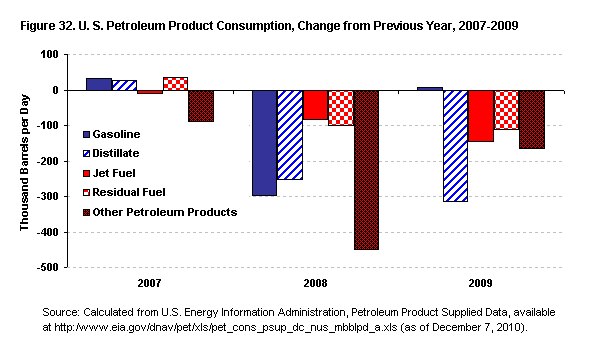
figure data
Petroleum product demand (represented by petroleum product supplied) in the United States dropped 3.7 percent in 2009 to 18.8 mmbd (Table 22), following 2008's decline of 5.7 percent. There had not been such large percentage declines in demand since 1981 and 1982. Consumption of gasoline increased slightly by 0.1 percent (8,000 barrels per day) in 2009, but consumption of all other major petroleum products (distillate fuel, jet fuel, and residual fuel) in 2009 declined substantially: 8.0 percent (314,000 barrels per day) for distillate, 9.5 percent (146,000 barrels per day) for jet fuel and 17.8 (111,000 barrels per day) for residual fuel (Figure 32).
Domestic crude oil production increased 8.3 percent (410,000 barrels per day) in 2009 from 2008, while NGL production increased 7.1 percent (126,000 barrels per day). Net imports of petroleum decreased by 13.0 percent (1.4 mmbd) in 2009. The excess of petroleum product supply over demand led to an injection of 109,000 barrels per day into petroleum product inventories.
Crude oil and NGL reserve additions in the United States in 2009 more than matched production with a combined reserve replacement rate of 194 percent. 108 This happened in part due to a new Securities and Exchange Commission (SEC) rule in 2009 requiring an average of first-day-of-the-month prices throughout the year to determine reserves rather than year-end prices as had been the case in 2008 when year-end prices were low. The new SEC rule also changed the methodology for determining reserves and allowed the inclusion of certain non-conventional oil in reserves.
U.S. refineries decreased output in 2009 by 264,000 barrels per day (1.4 percent) from 2008. 109 But that decline in output was exceeded by a decrease in U.S. petroleum product demand in 2009, leading to the 13.0-percent drop in net imports of petroleum previously mentioned.
Natural gas demand in the United States decreased 1.8 percent in 2009 to 22.8 trillion cubic feet (Table 23). Domestic natural gas production increased 3.3 percent in 2009 over 2008, following the 7.7 percent increase in 2008. The increase in natural gas production caused natural gas imports to decrease by 11.2 percent. U.S. natural gas reserve additions more than matched production, with a reserve replacement rate for natural gas of 229 percent, following last year's rate of 134 percent. 110 U.S. natural gas reserves increased to their highest level since the U.S. Energy Information Administration began reporting them in 1977.