Financial Developments
Net Income and Profitability
Net income for FRS companies fell 66 percent (in constant 2009 dollars) 1 to $30 billion in 2009 from $88 billion in 2008 (Table 1).
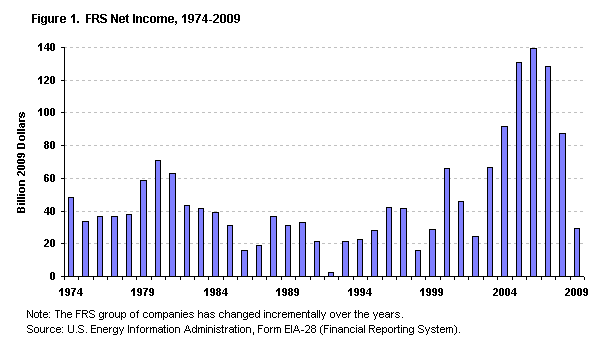
figure data
This was the lowest level of earnings since 2002 and was sharply lower than the record high levels of recent years (Figure 1). Substantial reductions in oil and natural gas prices in 2009 slowed revenue growth. FRS companies cut operating costs but by less than the decline in revenue, resulting in a 69-percent drop in operating income. FRS companies also reported a 43-percent decline in "Other Revenue," which was driven primarily by smaller gains on the sales of property, plant, and equipment and lower earnings for affiliates of FRS companies that are not included in the operating data.
FRS companies continued to write down assets in 2009 but the amount was significantly lower than in 2008. Natural gas prices generally declined in 2009, while oil prices generally rose from their level at the end of 2008. Excluding the effect of asset impairments and other special items, net income for FRS companies decreased 66 percent to $50 billion in 2009.
The FRS companies' return on stockholders' equity (ROE) fell to 5 percent in 2009, the lowest level since 1992 (figure 2).
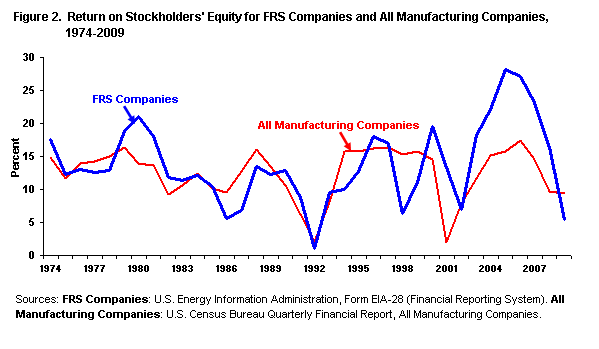
figure dataFor the first time since 2002, the profitability of FRS companies fell below that of the Census Bureau's All Manufacturing Companies (figure 3), which is a survey of the financial results of manufacturing corporations with assets greater than $250,000.
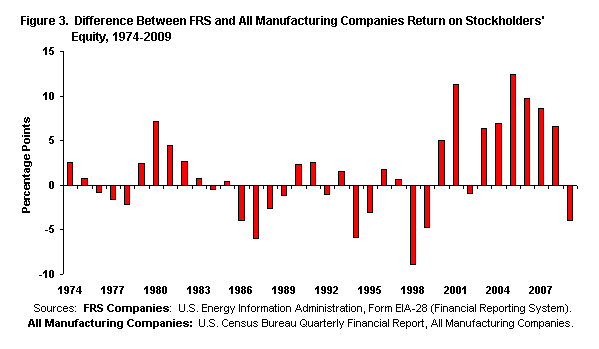
figure data
From 2000 to 2008, the FRS companies outperformed the Census Bureau's All Manufacturing Companies by an average of 7 percentage points, compared with an average 2 percentage points lower from 1985 to 1999, but in 2009, the FRS companies' ROE fell 4 percentage points below this industry benchmark.
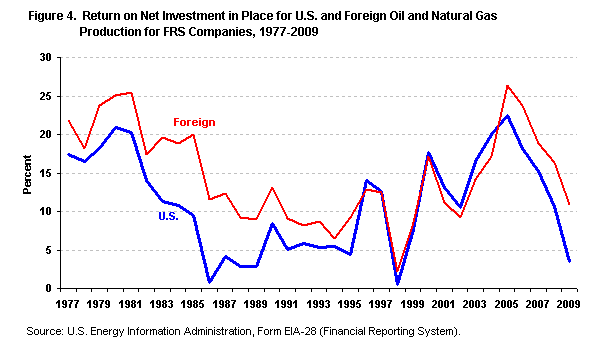
figure dataAmong the FRS companies' lines of business and business segments, oil and natural gas production continued to be the most profitable, contributing $42 billion in net income in 2009 (Table 2), although this was a decline of 43 percent from the 2008 level, due in large part to lower revenues as a result of much lower oil and natural gas prices. Return on net investment in place (ROI) for the oil and natural gas production segment fell to 7 percent in 2009 from 13 percent in 2008. The difference between domestic and foreign ROI widened as domestic oil and gas production ROI fell to 4 percent, the lowest level since 1998 (figure 4).
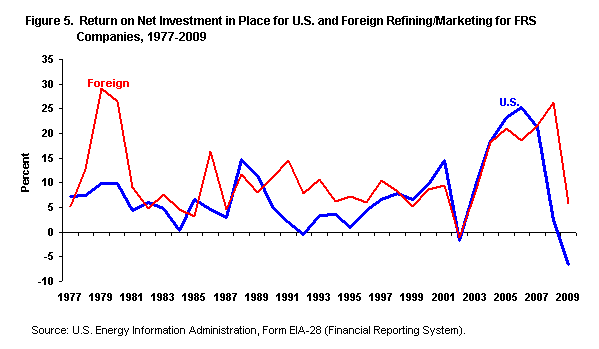
figure dataThe refining/marketing segment reported a loss of $7 billion in 2009, compared with a $14-billion gain in 2008. Domestic refining/marketing had a $9-billion loss in 2009, while foreign refining/marketing net income fell 77 percent to $3 billion. ROI for domestic refining/marketing in 2009 declined to the lowest level ever reported in the FRS survey, negative 7 percent. Foreign refining/marketing ROI remained positive but was significantly lower, dropping to 6 percent in 2009 from 26 percent in 2008 (figure 5).
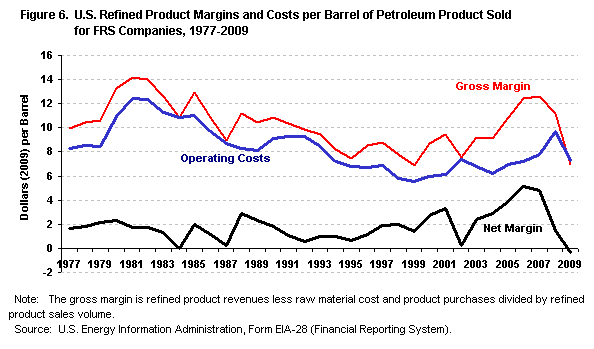
figure dataThe FRS companies' average domestic refining/marketing gross margin (essentially the difference between product prices and raw material input costs) dropped to the lowest level since 1999 and was the second lowest level ever reported on the survey (figure 6). Per-barrel operating costs also declined, but by a much smaller amount. Refinery energy costs fell 48 percent from 2008, reflecting the decline in petroleum and natural gas prices, while marketing costs and other operating costs each decreased by 17 percent. The combination of the lower average gross margin and operating costs led to the first negative net margin reported by FRS companies, negative $0.36 per barrel in 2009.
The marketing/trading segments of the downstream natural gas and electric power lines of business heavily influenced the earnings of these lines of business. Net income for the downstream natural gas line of business increased 88 percent to $7 billion in 2009 while electric power net income dropped from a $9-billion gain in 2008 to a $2-billion loss in 2009. The non-energy line of business reported net income of $1 billion in 2009 after showing a loss in 2008. Chemical operations account for a large portion of the non-energy line of business. Higher margins, higher sales volumes, and lower operating costs were cited as reasons for higher chemical earnings. 2
Cash Flow and Capital Expenditures
The cash flow statement provides information on sources and uses of cash, with sections for operations, investing activities, and financing activities. Cash flow from operations consists of net income after taxes plus depreciation and other noncash expenses. Investing activities include the net effect of buying and selling property, plant, and equipment. Financing activities include the net effect of issuing and purchasing company stock, issuing and paying off debt, and paying dividends. Major sources of cash include cash flow from operations, sales of assets, and proceeds from issuing debt or equity. Primary uses of cash include making capital expenditures, paying dividends, purchasing company stock, and paying off debt. Capital expenditures represent the value of assets acquired in the current time period net of depreciation and also include investments and advancements to unconsolidated affiliate companies. This report also refers to capital expenditures as additions to investment in place. The current cash flow statement was added to the survey in 1986.
The effects of the economic slowdown were evident in the FRS companies' cash flow statement in 2009, which showed declines in both sources and uses of cash. Cash flow from operations decreased 41 percent from 2008 to $131 billion in 2009 (Table 3), led by the decline in net income. Proceeds from the disposal of assets fell 52 percent to $12 billion in 2009 as the value of assets declined. Funds raised from equity security offerings declined 30 percent to $5 billion while proceeds from issuing long-term debt increased slightly to $77 billion.
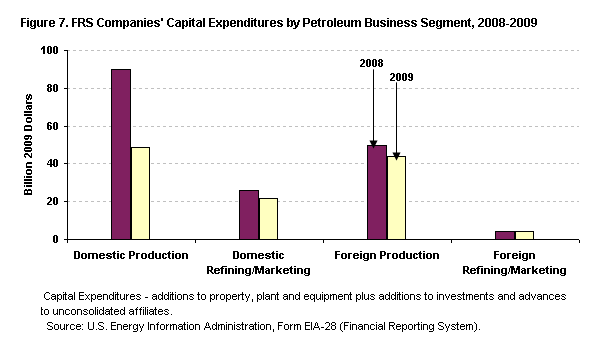
Capital expenditures fell 31 percent to $139 billion in 2009, but remained the largest use of cash. Despite the large decline, capital expenditures in 2009 remained higher than every year prior to 2005. Oil and natural gas production (domestic and foreign combined) accounted for 67 percent of the total and refining/marketing 19 percent. Domestic oil and natural gas production capital expenditures fell 46 percent in 2009 from 2008 and foreign upstream capital expenditures fell 11 percent (figure 7).
The amount of cash used to repurchase company stock fell 65 percent to $20 billion in 2009. Funds used to reduce long-term debt fell 10 percent from the previous year, which, combined with the slight increase in proceeds from long-term debt, resulted in an increase in the long-term debt to equity ratio to 39 percent, the highest since 2004. FRS companies maintained dividend payments, which increased 2 percent to $32 billion.
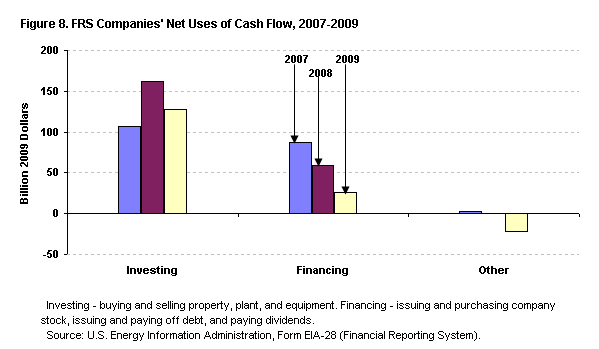
figure data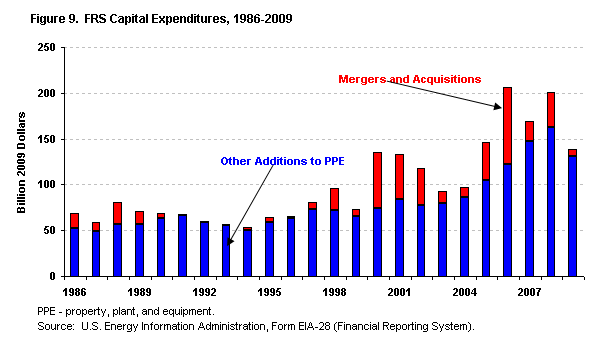
figure dataOverall, net uses of cash for investing activities decreased 22 percent to $127 billion in 2009 (figure 8). Merger and acquisition activity fell to the lowest level since 1999. (See Table 4 for a listing of some of the acquisition transactions.) Other additions to property, plant, and equipment declined for the first time since 2002 but remained higher than every year prior to 2007 (figure 9). Net uses of cash for financing activities dropped to $26 billion in 2009 from $59 billion in 2008 primarily as a result of much lower repurchases of company stock. Total uses of cash exceeded sources, resulting in the largest decline in cash and cash equivalents ever reported in the FRS survey, a decrease of $21 billion in 2009.
Oil and Gas Production Expenditures
In addition to capital expenditures, FRS companies report expenditures for unproved and proved property acquisition, exploration, development, and production (E&P) for the oil and natural gas production segment. The data include current and capital expenditures, but capital expenditures predominate.
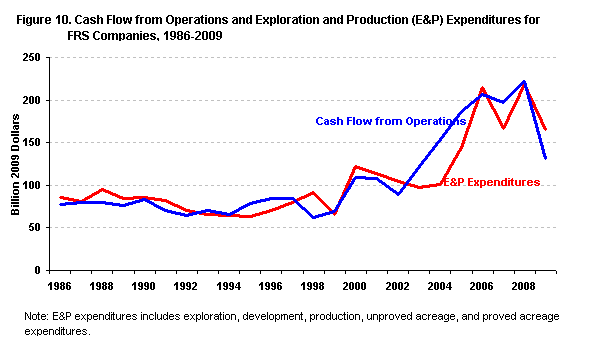
figure dataE&P expenditures decreased 24 percent from 2008 to $166 billion in 2009 (Figure 10). The $52 billion decline in E&P expenditures was considerably less than the $90 billion drop in cash flow from operations, and the 2009 expenditure level remained higher than every year prior to 2006. Expenditures for development accounted for 43 percent of the 2009 E&P expenditure total and production added 39 percent. Exploration comprised 10 percent of the total, the highest share since 1999. Acquisition expenditures fell in 2009; their share of expenditures declined to 7 percent.
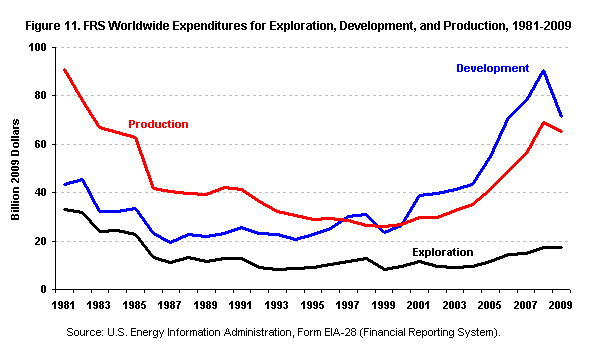
figure dataCompared with the 2008 level, development expenditures decreased 21 percent to $71 billion in 2009 (figure 11). It was the first decline in development expenditures since 1999. Exploration expenditures fell 1 percent to $17 billion but remained higher than every year from 1986 through 2007. Expenditures for production declined 6 percent to $65 billion in 2009.
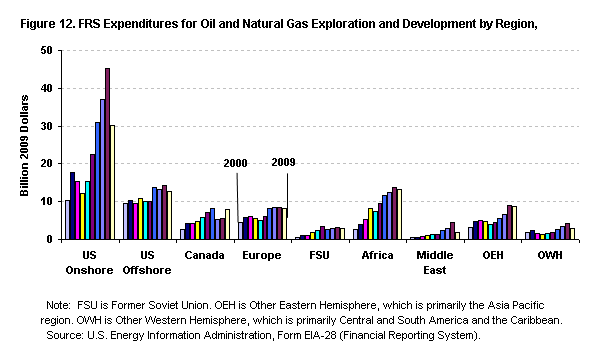
figure dataRegional expenditures are also reported, which provide insight into trends in upstream investment by FRS companies across world regions. The U.S. Onshore remains the most active region for the FRS companies' oil and natural gas operations. Expenditures for exploration and development (excluding expenditures for acquisitions) in the U.S. Onshore region fell 34 percent from 2008 to $30 billion in 2009 (figure 12), which, despite the decline, remained nearly twice the level in 2004. Expenditures for development predominate in the U.S. Onshore region: they declined to $25 billion in 2009, which was 35 percent of FRS companies' development expenditures worldwide. Exploration expenditures, though considerably smaller than development expenditures, decreased 2 percent in 2009 to $5 billion.
figure dataExploration and development expenditures in the U.S. Offshore region decreased 10 percent from 2008 to $13 billion in 2009 (figure 12). Expenditures for exploration account for 33 percent of the total in the U.S. Offshore region, compared with an average of 20 percent for FRS worldwide expenditures.
Exploration and development expenditures in foreign FRS regions decreased 5 percent from 2008 to $46 billion in 2009. All regions except Canada declined from the previous year. Exploration and development expenditures in Canada jumped 42 percent from 2008 to $8 billion in 2009. This was the first year that companies included expenditures from oil sands mining operations in the oil and gas production segment, because of a new Securities and Exchange Commission (SEC) rule. Development spending accounted for nearly all of the increase.
In 2009, FRS companies put more exploration and development expenditures into Africa than any other foreign region, as they have every year since 2002. Exploration and development expenditures in Africa decreased 4 percent from 2008 to $13 billion in 2009. Exploration and development expenditures in the Other Eastern Hemisphere region were the second highest among the FRS foreign regions, remaining slightly ahead of Canada and Europe despite declining 3 percent from 2008 to $9 billion in 2009.
Refining/Marketing Capital Expenditures
figure dataCapital expenditures for the FRS companies' domestic refining/marketing segment decreased 16 percent from 2008 to $22 billion in 2009 while foreign refining/marketing capital expenditures increased 2 percent (figure 7).
Despite the net income loss reported by domestic refining/marketing, capital expenditures in 2009 remained higher than all but 3 prior years in the survey. From 2000 to 2009, average annual capital expenditures in the FRS domestic refining/marketing segment were twice that of 1990 to 1999, which reflects the improved return on investment throughout most of this period compared with the 1990s.