Energy Perspectives 1949–2011
September 2012 PDF | previous editions
Release Date: September 27, 2012
Introduction
Energy Perspectives is a graphical overview of energy history in the United States. The 42 graphs shown here reveal sweeping trends related to the Nation's production, consumption, and trade of energy from 1949 through 2011.
Energy Flow, 2011 (Quadrillion Btu)
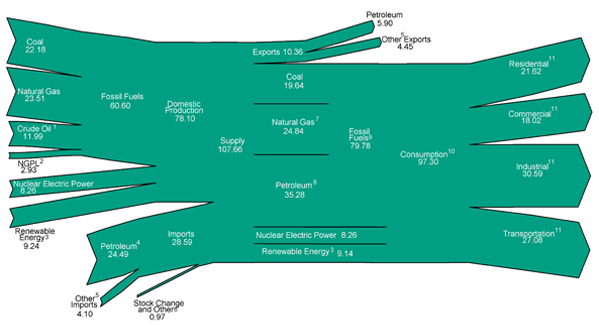
For footnotes see here.
Energy can be grouped into three broad categories. First, and by far the largest, is the fossil fuels–coal, petroleum, and natural gas. Fossil fuels have stored the sun's energy over millennia past, and it is primarily that captured energy that we are drawing on today to fuel the activities of the modern economy. Use of the individual fossil fuels changed at different rates over the decades but all three major forms have been essential to meeting the Nation's energy requirements. In 1949, fossil fuel consumption in the United States totaled 29 quadrillion British thermal units (Btu); in 2011, the total was 80 quadrillion Btu.
The second major category of energy is nuclear power, which is a relative newcomer in the energy business. The nuclear electric power industry got its start in this country in 1957, when the Shippingport, Pennsylvania, nuclear electric power plant came on line. By 2011, the industry had expanded to supply 19 percent of the Nation's electrical output and 8 percent of all primary energy.
Renewable Energy as Share of Total Primary Energy Consumption, 2011
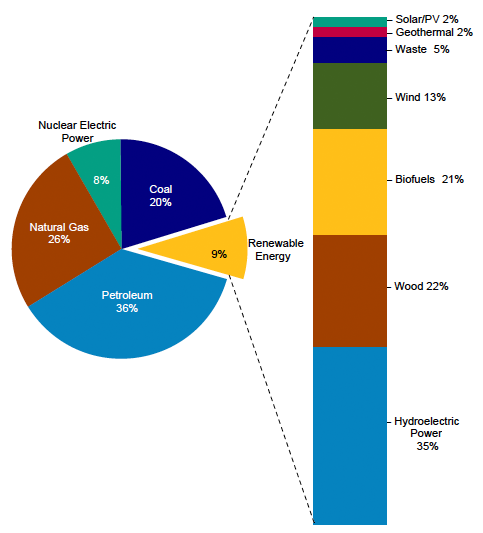
The third category is renewable energy. Unlike fossil fuels, which are finite in supply, renewable energy is essentially inexhaustible because it is naturally replenished. Renewable energy includes conventional hydroelectric power, which is power derived from flowing water; biomass such as wood, waste, and biofuels; geothermal; solar; and wind. Before the great expansion in fossil fuel use that began with coal in the late 1800s, wood was the primary fuel used in this country. Today, we are looking again at renewable resources to find new ways to help meet our energy needs. In 2011, all forms of renewable energy together accounted for 9 percent of U.S. primary energy consumption.
The U.S. Energy Information Administration invites you to study the trends appearing in this update of Energy Perspectives. For greater detail of data and illustrations, please see the main report, the Annual Energy Review 2011. For the most current data for many of the time series, see the Monthly Energy Review.