Annual Energy Review
September 2012 PDF | previous editions
Release Date: September 27, 2012
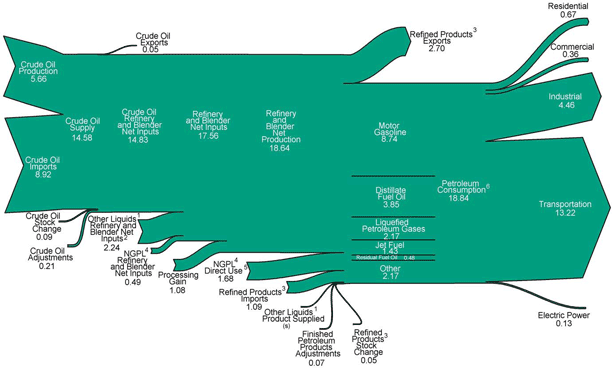
Petroleum Flow, (Million Barrels per Day)
Footnotes:
1 Unfinished oils, hydrogen/oxygenates/renewables/other hydrocarbons, and motor gasoline
and aviation gasoline blending components.
2 Renewable fuels and oxygenate plant net production (0.972), net imports (1.164) and adjustments
(0.122) minus stock change (0.019) and product supplied (0.001).
3 Finished petroleum products, liquefied petroleum gases, and pentanes plus.
4 Natural gas plant liquids.
5 Field production (2.183) and renewable fuels and oxygenate plant net production (-.019) minus refinery and blender net imputs (0.489).
6 Production minus refinery input.
(s)= Less than 0.005.
Notes:
• Data are preliminary.
• Values are derived from source data prior to rounding for publication.
• Totals may not equal sum of components due to independent rounding.
Sources:
U.S. Energy Information Administration, Annual Energy Review 2011
Tables 5.1b, 5.3, 5.5, 5.8, 5.11, 5.13a-5.13d, 5.16; U.S. Energy Information Administration, Petroleum Supply Monthly, February 2012, Table 4; and revisions to crude oil production and adjustments (see sources for Table 5.1b).