Annual Energy Review
September 2012 PDF | previous editions
Release Date: September 27, 2012
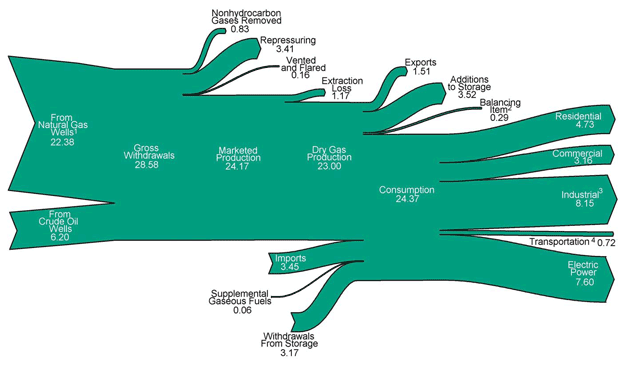
Natural Gas Flow, (Trillion Cubic Feet)
Footnotes:
1 Includes natual gas gross withdrawals from coalbed wells and shale gas wells.
2 Quantities lost and imbalances in data due to differences among data sources.
3 Lease and plant fuel, and other industrial.
4 Natural gas consumed in the operation of pipelines (primarily in compressors), and as fuel in
the delivery of natural gas to consumers; plus a small quantity used as vehicle fuel.
Notes:
• Data are preliminary.
• Values are derived from source data prior to rounding for publication.
• Totals may not equal sum of components due to independent rounding.
Sources:
U.S. Energy Information Administration, Annual Energy Review 2011 Tables 6.1, 6.2, and 6.5.