
Global liquefied natural gas trade volumes reached record high in 2025
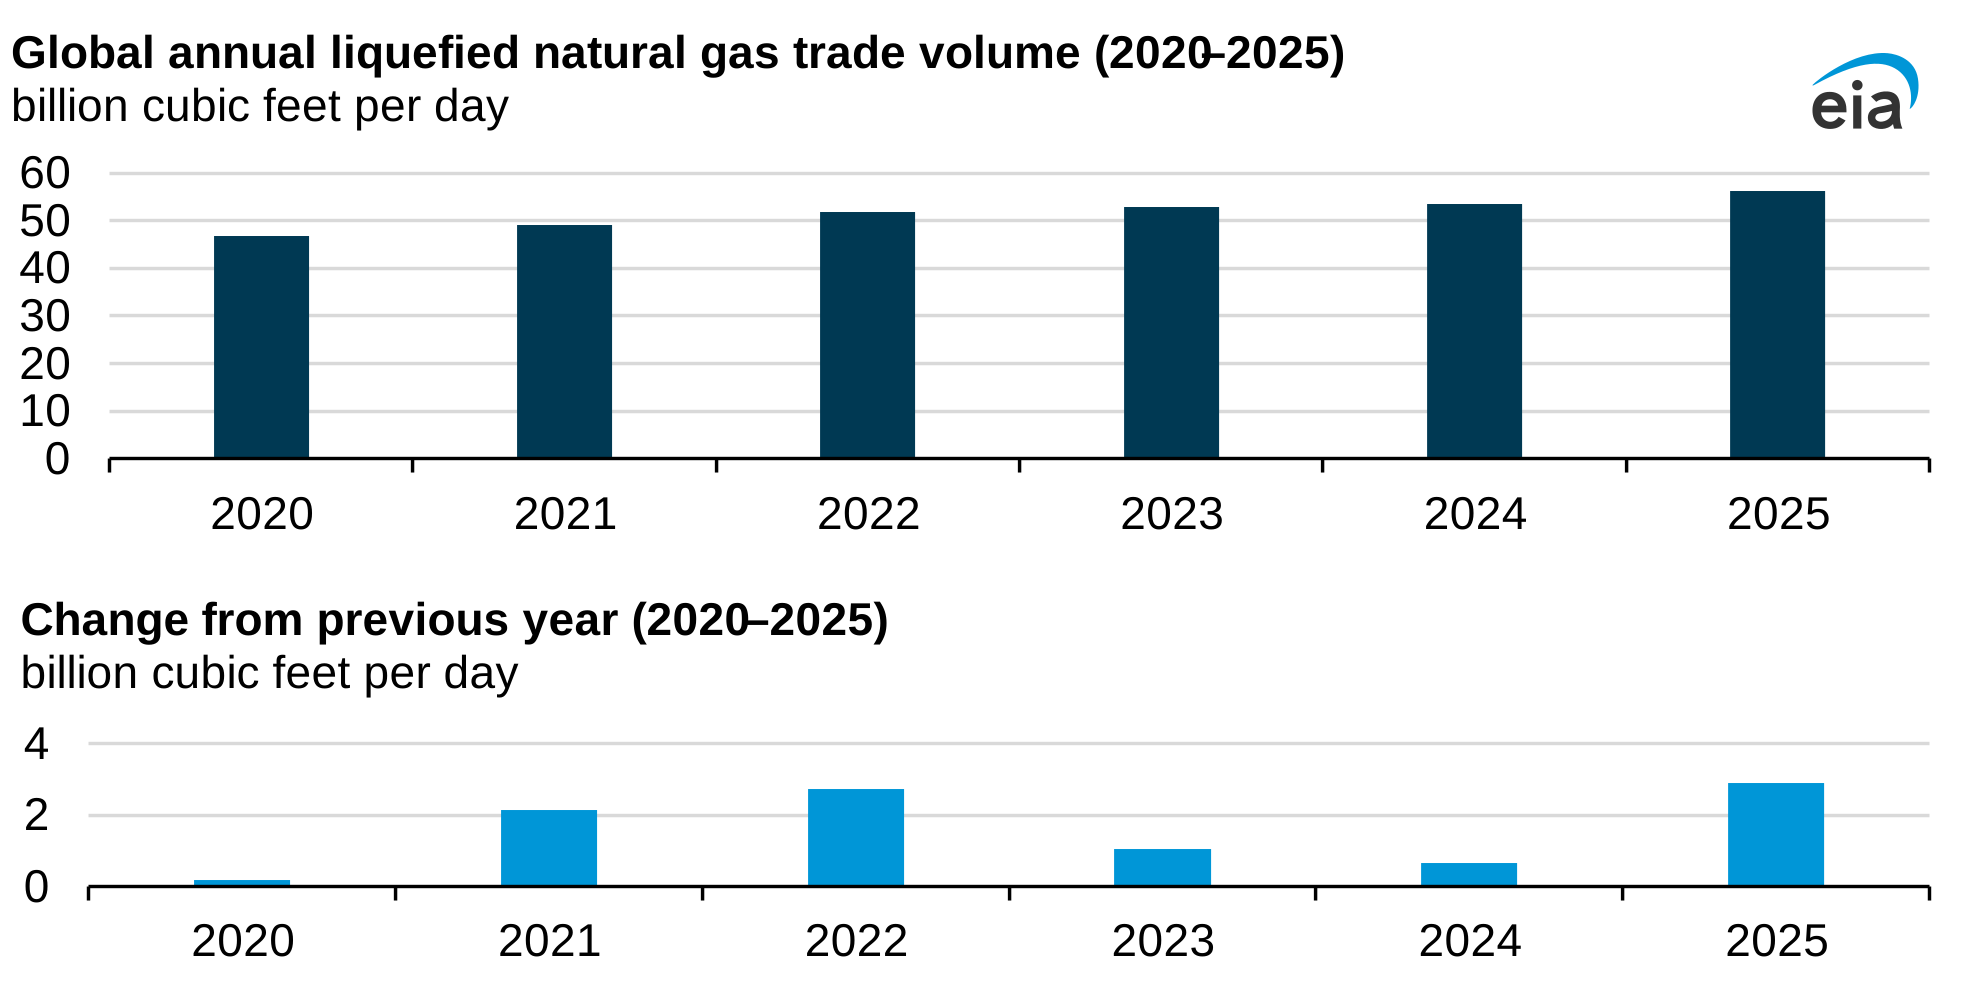
Global liquefied natural gas (LNG) trade volumes increased 5.4% to a record 56.3 billion cubic feet per day last year (Bcf/d), driven largely by U.S. LNG export capacity expanding to meet growing demand, according to a recent report from the International Group of Liquefied Natural Gas Importers (GIIGNL). Global LNG trade has slowed this year following the closure of the key export route for Qatar, the world’s second-largest LNG exporter.
LNG exports from the United States increased by 26% to 15.1 Bcf/d in 2025, a larger increase than from any other country, according to our Natural Gas Monthly. We forecast U.S. LNG exports will increase further, to 17.4 Bcf/d of LNG in 2026 and 18.6 Bcf/d in 2027 in our Short-Term Energy Outlook.
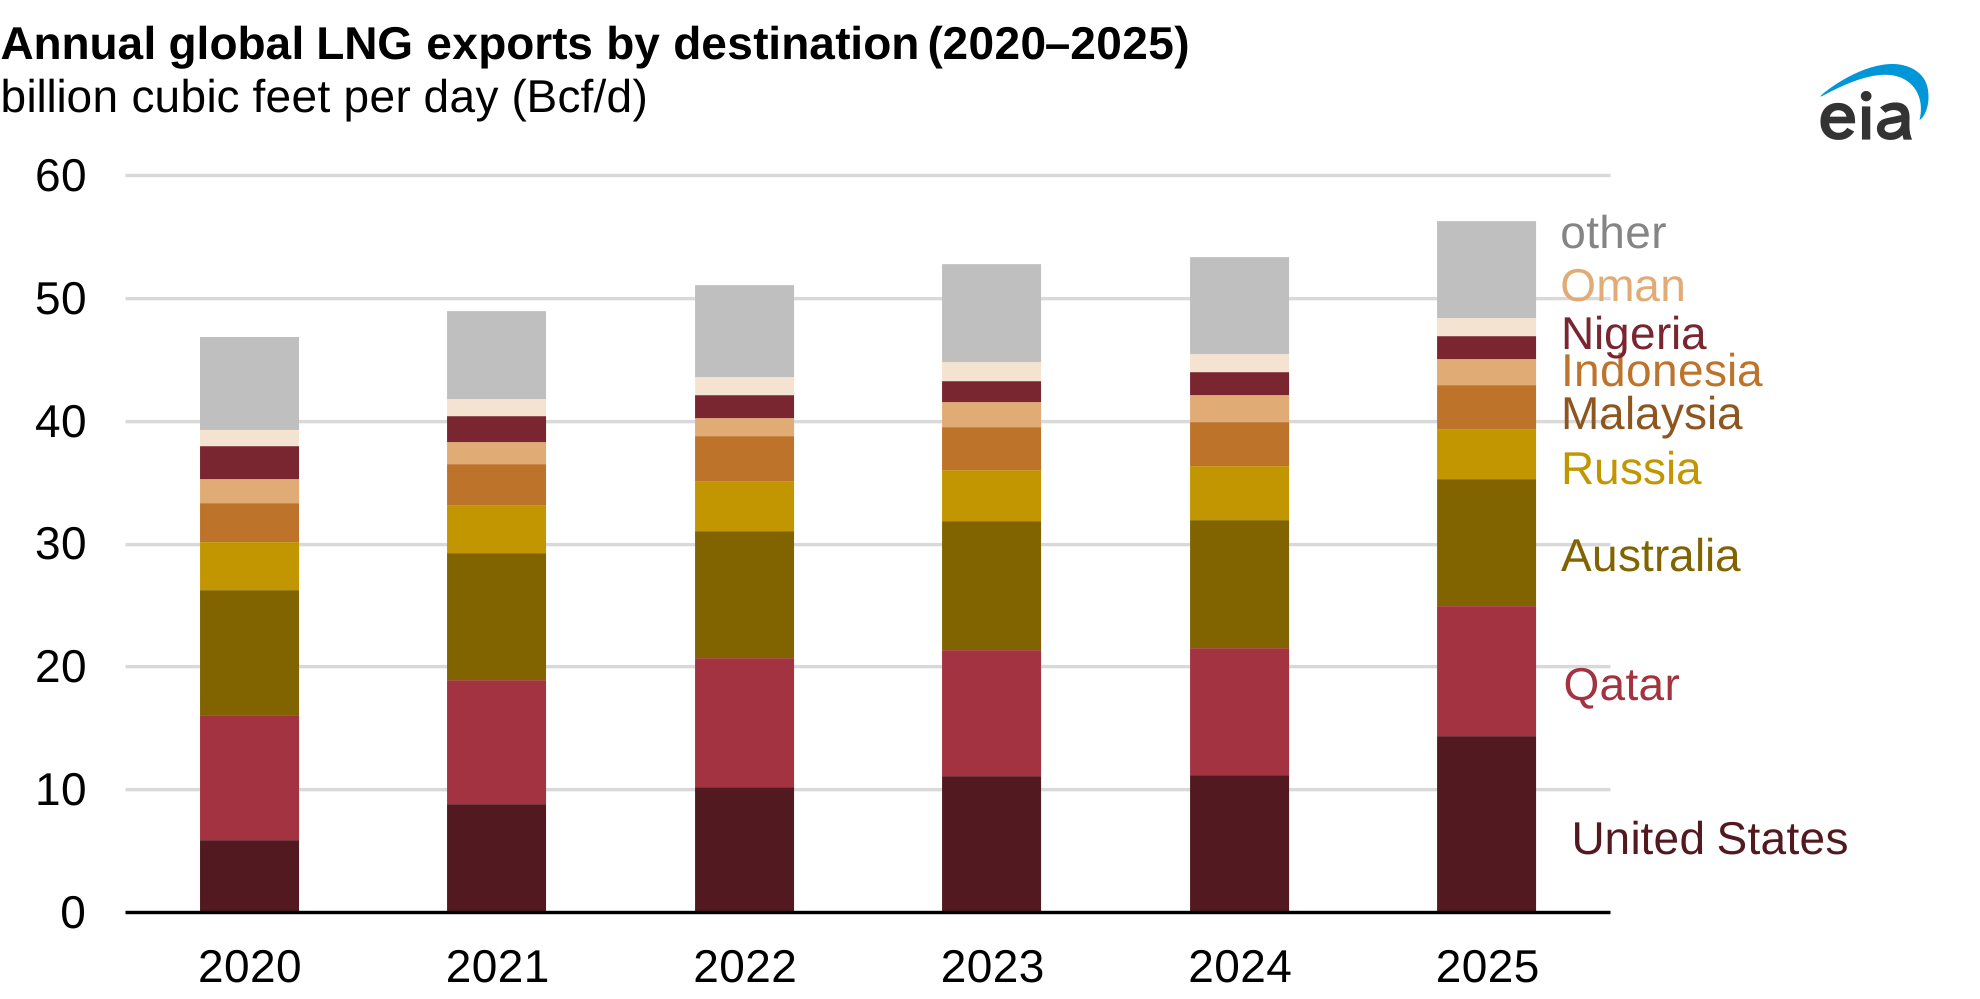
U.S. exports amounted to 26% of the global total in 2025, up from 21% in 2024. The United States, Qatar, and Australia, the three largest LNG exporters globally, made up a combined 63% of global exports, up from 60% in 2024. Canada exported 0.3 Bcf/d of LNG in 2025 after LNG Canada began operations in June.
Qatar reported the second-largest increase in LNG exports, rising 3% to 10.6 Bcf/d in 2025. However, Qatari exports have fallen in 2026 due to the closure of the Strait of Hormuz since February 28, which has cut off approximately 20% of global LNG supplies. Until LNG flows through the strait return to historical norms, Asian buyers, who in 2025 imported over 80% of Qatari volumes, are competing on the global spot market with European buyers seeking to refill storage inventories, which are currently at a deficit to the five-year average.
Some exporters, including Malaysia, Australia, and Norway, reported decreases compared with 2024 due to facility maintenance. Russian LNG exports fell 8% (0.4 Bcf/d) in 2025, the largest volumetric decrease of any exporter, on the impact of EU sanctions stemming from the invasion of Ukraine.
European countries increased imports by 29% (3.8 Bcf/d) in 2025, leading all regions worldwide.
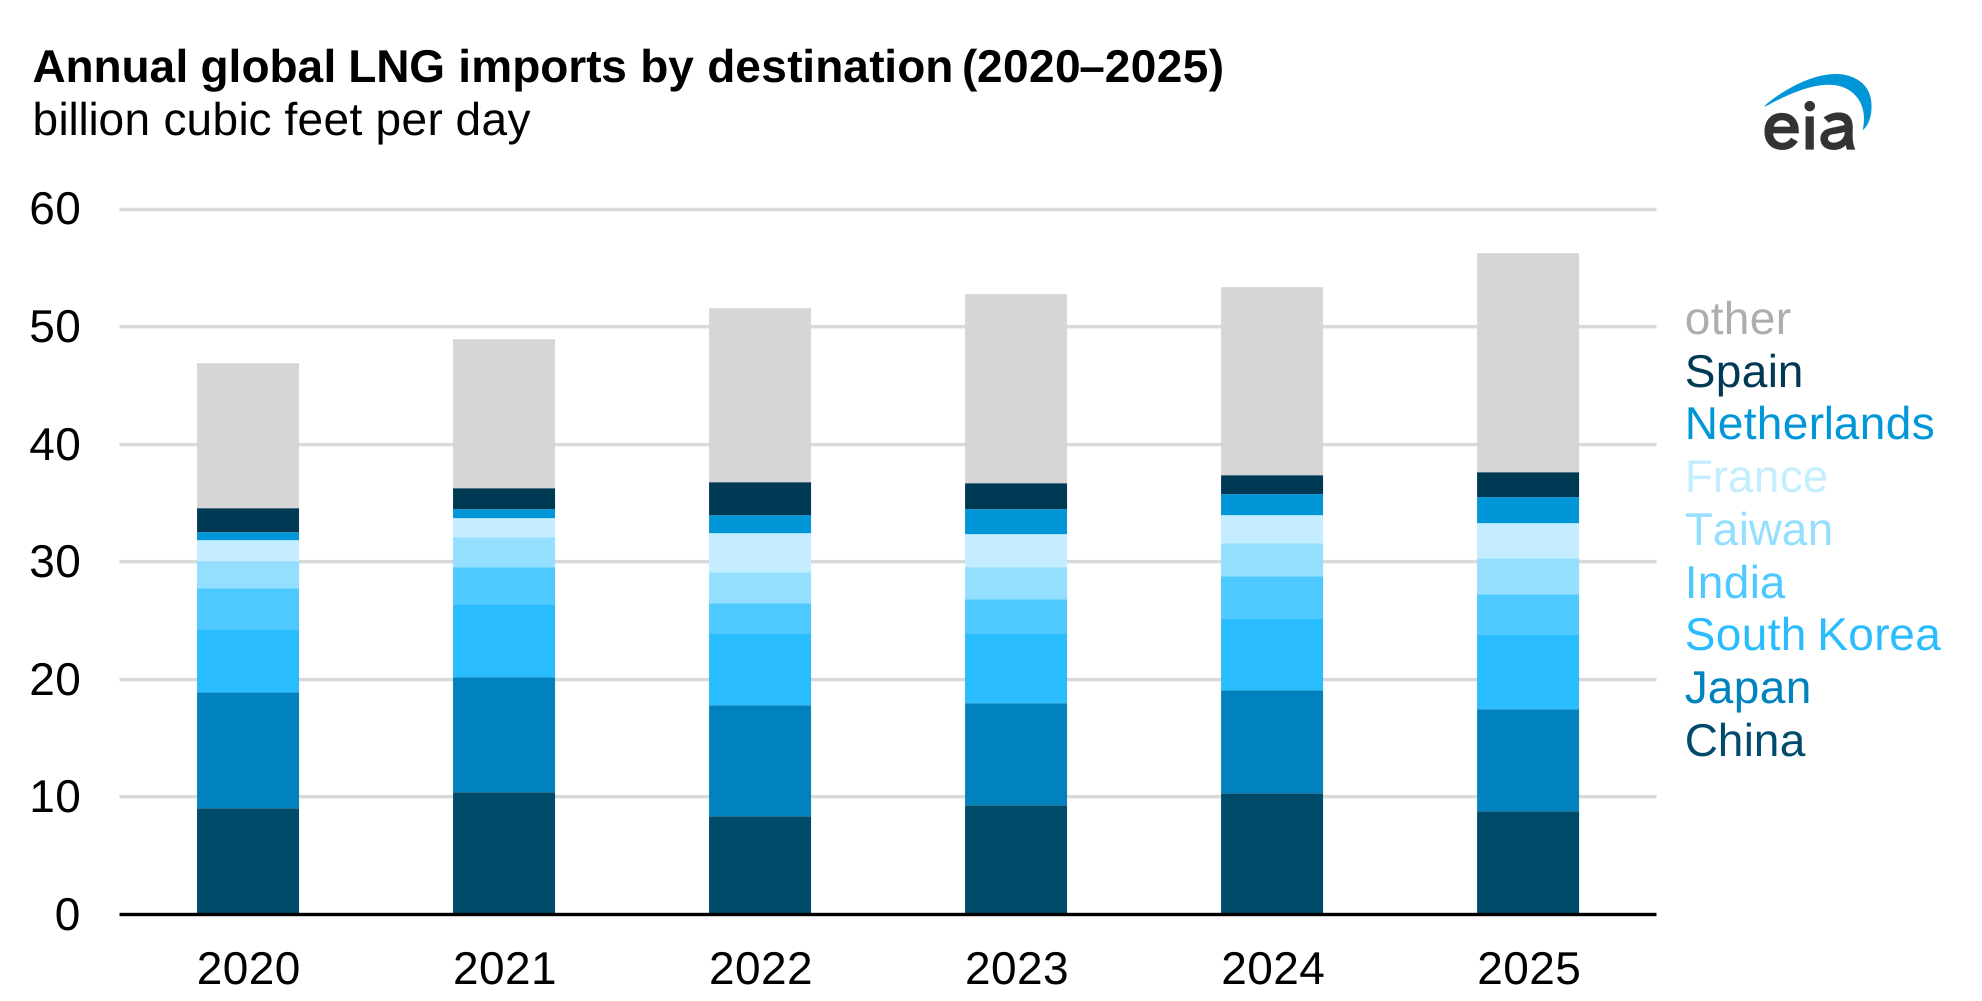
Europe’s seven largest importers added between 0.4 Bcf/d and 0.6 Bcf/d of LNG imports each. The expiration of the Ukraine-Russia gas transit agreement at the end of 2024 reduced pipeline gas supplies into Europe and increased LNG import requirements. Imports into Asian countries fell 4% compared with 2024 to 35.7 Bcf/d, largely driven by a 15% (1.5 Bcf/d) reduction in imports to China, which expanded its pipeline gas imports and local production to capture a greater share of its domestic natural gas market.
Elsewhere, Egypt increased imports to 1.2 Bcf/d in 2025 from 0.3 Bcf/d in 2024 as a domestic supply shortage led to an increase in LNG imports. Bahrain and Senegal imported their first LNG cargoes in 2025, each importing less than 0.1 Bcf/d. Outside of these three countries, LNG imports into the Middle East and Africa were essentially unchanged in 2025, while LNG imports in the Americas fell by 0.3 Bcf/d.
Principal contributor: Jordan Young