U.S. LNG export capacity to grow as three additional projects begin construction

Note: EIA estimates are based on information from Federal Energy Regulatory Commission and U.S. Department of Energy filings, company websites, trade press, and other industry sources.
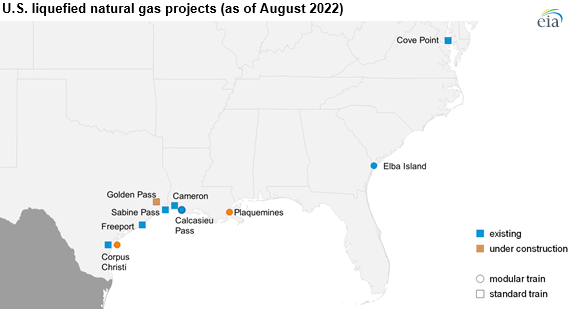
The United States began exporting liquefied natural gas (LNG) from the U.S. Lower 48 states in February 2016. As of July 2022, the United States has more LNG export capacity than any other country and has exported more LNG than any other country. U.S. LNG exports averaged 11.1 billion cubic feet per day (Bcf/d) during the first half of 2022. The seventh, and most recent, U.S. LNG export project—Calcasieu Pass LNG—placed all of its liquefaction trains in service by August, ahead of schedule. In addition to Golden Pass LNG, which started construction in 2019, two more projects on the U.S. Gulf Coast have recently begun construction.
Golden Pass LNG is constructing standard-size liquefaction trains with peak LNG production capacity of up to 0.8 Bcf/d per train. In contrast, the other two projects under construction, Plaquemines LNG and Corpus Christi Stage III, use a modular technology with mid-scale refrigeration trains, which has a shorter project construction timeline. Calcasieu Pass LNG, which also uses mid-scale liquefaction technology, started LNG production 30 months after its final investment decision—the shortest construction period for any U.S. LNG export project so far.
Once completed, the three export projects under construction will expand U.S. LNG peak export capacity by a combined 5.7 Bcf/d by 2025:
- Golden Pass LNG consists of three standard-size trains, each with a peak capacity of 0.8 Bcf/d, for a total capacity of 2.4 Bcf/d. Golden Pass LNG is on the site of an existing regasification facility and will use shared infrastructure, which helps to reduce project costs and shorten the construction timeline.
- Plaquemines LNG consists of 24 mid-scale trains, each with a peak capacity of 0.07 Bcf/d. Each liquefaction train is part of a two-unit block for a total of 12 blocks with a combined peak capacity of 1.8 Bcf/d.
- Corpus Christi Stage III is on the site of an existing terminal with three liquefaction trains in operation. Each of the 14 new, mid-scale trains under construction has a peak capacity of 0.11 Bcf/d. Each train is part of a two-unit block for a total of seven blocks with a combined peak capacity of 1.6 Bcf/d.
The latest information on the status of U.S. liquefaction facilities, including expected online dates and capacities, is available in our quarterly database of U.S. LNG export facilities.
Principal contributors: Victoria Zaretskaya, James Easton