
U.S. liquefied natural gas export capacity will be world’s largest by end of 2022
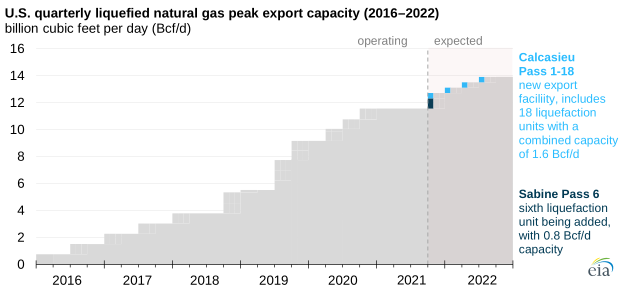
U.S. liquefied natural gas (LNG) export capacity has grown rapidly since the Lower 48 states first began exporting LNG in February 2016. In 2019, the United States became the world’s third-largest LNG exporter, behind Australia and Qatar. Once the new LNG liquefaction units, called trains, at Sabine Pass and Calcasieu Pass in Louisiana are placed in service by the end of 2022, the United States will have the world’s largest LNG export capacity.
The following new LNG export capacity additions will come online by the end of 2022, according to announced project plans:
- Train 6 at the Sabine Pass LNG export facility. Train 6 will add up to 0.76 billion cubic feet per day (Bcf/d) of peak export capacity. Train 6 began producing LNG in late November; the first export cargo from this train is expected to be shipped before the end of 2021.
- Calcasieu Pass LNG. This new export facility has 18 liquefaction trains with a combined peak capacity of 12 million metric tons per annum (1.6 Bcf/d). Commissioning activities at Calcasieu Pass LNG started in November 2021; the first LNG production is expected before the end of this year. All liquefaction trains are expected to be operational by the end of 2022.
The nameplate, or nominal, capacity of a liquefaction facility specifies the amount of LNG produced in a calendar year under normal operating conditions, based on the engineering design of a facility. Peak LNG production capacity is the amount of LNG produced under optimal operating conditions, including modifications to production processes that increase operational efficiency.
In October 2021, the U.S. Federal Energy Regulatory Commission (FERC) approved requests to increase authorized LNG production at the Sabine Pass and Corpus Christi LNG terminals by a combined 261 billion cubic feet per year (0.7 Bcf/d). The terminals will achieve these increases by optimizing operations, including production uprates and modifications to maintenance.
As of November 2021, we estimate that U.S. LNG nominal liquefaction capacity was 9.5 Bcf/d and peak capacity was 11.6 Bcf/d. This peak capacity includes uprates to LNG production capacity at Sabine Pass and Corpus Christi.
By the end of 2022, U.S. nominal capacity is expected to increase to 11.4 Bcf/d, and peak capacity will increase to 13.9 Bcf/d, exceeding capacities of the two largest LNG exporters, Australia (which has an estimated peak LNG production capacity of 11.4 Bcf/d) and Qatar (peak capacity of 10.4 Bcf/d). In 2024, when construction on Golden Pass LNG—the eighth U.S. LNG export facility—is completed and the facility begins operations, U.S. LNG peak export capacity will further increase to an estimated 16.3 Bcf/d.
The latest information on the status of U.S. liquefaction facilities, including expected online dates and capacities, is available in our database of U.S. LNG export facilities.
Principal contributor: Victoria Zaretskaya