
Liquefied natural gas exports continue to lead growth in U.S. natural gas exports
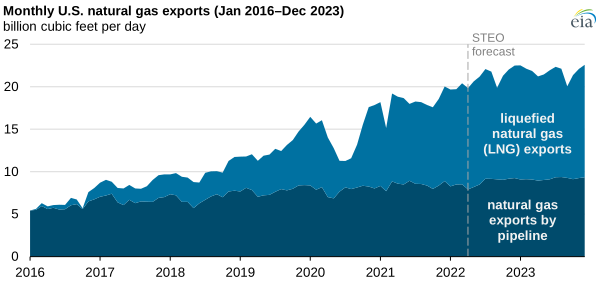
Since the United States began exporting more natural gas than it imports on an annual basis in 2017, natural gas exports both by pipeline and as liquefied natural gas (LNG) have grown significantly. In our Short-Term Energy Outlook (STEO), we forecast that LNG exports will continue to lead the growth in U.S. natural gas exports and average 12.2 billion cubic feet per day (Bcf/d) in 2022. If realized, the United States would surpass Australia and Qatar and become the world’s top LNG exporter this year.
We expect annual U.S. LNG exports to increase by 2.4 Bcf/d in 2022 and 0.5 Bcf/d in 2023. We forecast that natural gas exports by pipeline to Mexico and Canada will increase slightly, by 0.3 Bcf/d in 2022 and by 0.4 Bcf/d in 2023, primarily as a result of more exports to Mexico. The United States currently ranks second in the world in natural gas exports, behind Russia.
U.S. LNG exports exceeded pipeline exports of natural gas for the first time on an annual basis in 2021. Monthly LNG exports continued to set new records in 2021 and averaged 11.3 Bcf/d this winter, 2.2 Bcf/d more than last winter. In March 2022, U.S. LNG exports reached a new high of 11.9 Bcf/d. U.S. LNG export capacity increased in 2021 with the addition of Sabine Pass Train 6 and capacity expansions at Sabine Pass and Corpus Christi LNG export terminals.
By the end of 2022, once the new Calcasieu Pass LNG export facility is placed in service, the United States will have more LNG export capacity than any other country in the world. We expect that relatively high LNG demand in Asia and Europe will support continued U.S. LNG exports.
U.S. exports by pipeline also increased in 2021 as Mexico continued to expand its domestic pipeline network. The increase in flows via Sur de Texas-Tuxpan Pipeline and the Trans-Pecos Pipeline (part of the Wahalajara system) allowed more natural gas to flow to the Mérida markets in the Yucatán Peninsula and to power plants in the Mexico City and Guadalahara regions in central and west-central Mexico.
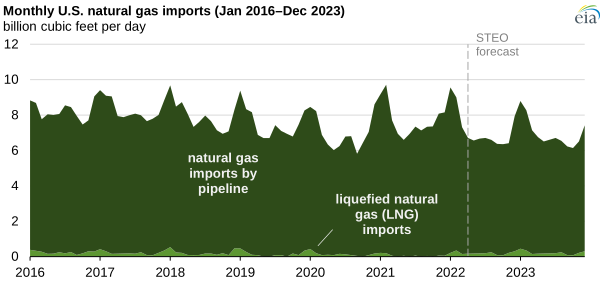
We expect U.S. natural gas imports to decrease by 0.5 Bcf/d in 2022 and by 0.2 Bcf/d in 2023 because natural gas production from the Appalachia region will likely continue to displace imports from Canada in the midwestern states. We expect LNG imports, primarily into New England in the winter months, to remain essentially unchanged in the next two years.
Principal contributor: Victoria Zaretskaya