The United States consumed a record amount of renewable energy in 2020
Note: Click for full U.S. renewable energy chart.
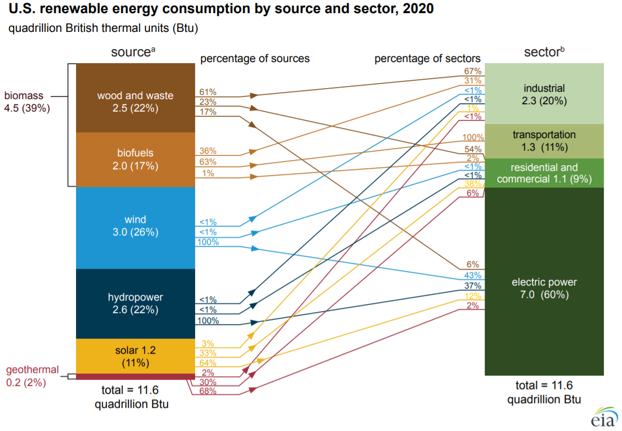
In 2020, consumption of renewable energy in the United States grew for the fifth year in a row, reaching a record high of 11.6 quadrillion British thermal units (Btu), or 12% of total U.S. energy consumption. Renewable energy was the only source of U.S. energy consumption that increased in 2020 from 2019; fossil fuel and nuclear consumption declined. Our U.S. renewable energy consumption by source and sector chart shows how much renewable energy by source each sector consumes.
We convert sources of energy to common units of heat, called British thermal units (Btu), to compare different types of energy that are usually measured in units that are not directly comparable, such as gallons of biofuels compared with kilowatthours of wind energy.
We use a fossil fuel equivalence to calculate primary energy consumption of noncombustible renewables (wind, hydro, solar, and geothermal), which are not burned to generate electricity and therefore do not have an inherent Btu conversion rate. In this approach, we convert the noncombustible renewables from kilowatthours to Btu using the annual weighted-average Btu conversion rate for all fossil fuels burned to generate electricity in the United States during that year to estimate the amount of fossil energy replaced by these renewable sources.
We use the fossil fuel equivalency approach to report noncombustible renewables’ contribution to total primary energy, in part, because the resulting shares of primary energy are closer to the shares of generated electricity. This calculation also represents the energy that would have been consumed if the electricity from renewable sources had instead been generated by a mix of fossil fuels.

Wind energy, or electricity generated by wind-powered turbines, is almost exclusively consumed in the electric power sector. Wind energy accounted for about 26% of U.S. renewable energy consumption in 2020. Wind surpassed hydroelectricity in 2019 to become the single most-consumed source of renewable energy on an annual basis. In 2020, U.S. wind energy consumption grew 14% from 2019.
Hydroelectric power, or electricity generated by water-powered turbines, is almost exclusively consumed in the electric power sector. It accounted for about 22% of U.S. renewable energy consumption in 2020. U.S. hydropower consumption has remained relatively flat since the 1970s, but it fluctuates with seasonal rainfall and drought conditions.
Wood and waste energy, including wood, wood pellets, and biomass waste from landfills, accounted for about 22% of U.S. renewable energy consumption in 2020. Industrial, commercial, and electric power facilities use wood and waste as a fuel to generate electricity, produce heat, and manufacture goods.
Biofuels, including fuel ethanol, biodiesel, and other renewable fuels, accounted for about 17% of U.S. renewable energy consumption in 2020. U.S. biofuel consumption fell 11% from 2019 as overall transportation sector energy use declined in the United States during the COVID-19 pandemic.
Solar energy accounted for about 11% of U.S. renewable energy consumption in 2020. Solar photovoltaic (PV) cells, including rooftop panels, and solar thermal power plants use sunlight to generate electricity. Some residential and commercial buildings use solar heating systems to heat water and the building. Overall, 2020 U.S. solar consumption increased 22% from 2019.
Principal contributor: Mickey Francis
Tags: generation, consumption/demand, electricity, renewables, wind, biomass, geothermal, hydroelectric, solar, biofuels