
Energy expenditures per dollar of GDP are highest in energy-producing states
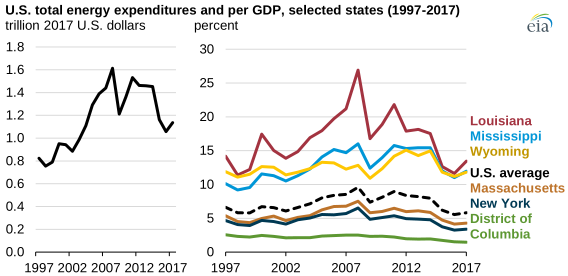
According to the U.S. Energy Information Administration’s (EIA) State Energy Data System (SEDS), every state saw increased total energy expenditures and total energy expenditures as a percentage of gross domestic product (GDP) in 2017 compared with the previous year. Only the District of Columbia had a decrease in total energy expenditures. States such as Louisiana, Mississippi, and Wyoming, which tend to have relatively more energy-intensive industries, have a much higher percentage of energy expenditures per dollar of GDP. The District of Columbia and states that have concentrated urban areas with less energy-intensive industries, such as Massachusetts and New York, have the lowest expenditures per GDP.
U.S. total energy expenditures (the amount of money spent to consume energy in the United States) increased in 2017 for the first time since 2014, reaching $1.14 trillion. U.S. GDP, calculated as the total value of goods and services produced in the United States including energy, totaled $19.5 trillion in 2017, 4% more than 2016 levels in nominal terms and 2% more in real terms (adjusted for inflation).
In 2017, U.S. energy expenditures per GDP reached 5.8%, up from a record low of 5.6% in 2016, after its first annual increase since 2011. These increases are primarily a result of increased average U.S. energy prices, up almost 9% nationally from 2016 to 2017. Average U.S. prices for petroleum and natural gas increased by 14% and 13%, respectively, and electricity prices increased by 2%. Total U.S. energy consumption increased by less than 1% during the same time.
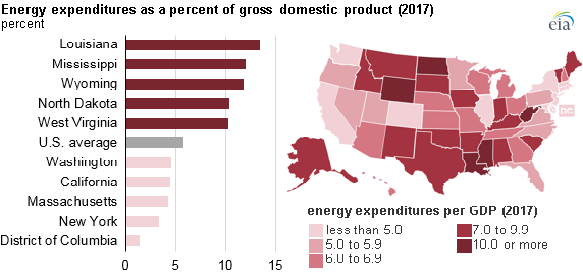
Louisiana had the highest energy expenditures per GDP of any state in 2017 at 13.5%. In this ranking, Louisiana has been the highest every year since 1997, the earliest year for which EIA has state data. In 2017, 50% of the state’s total energy expenditures occurred in the industrial sector, which includes its energy-intensive petrochemical industry. Overall, Louisiana’s total energy expenditures increased by nearly 21% from 2016 to 2017, the largest percentage increase of any state during that period.
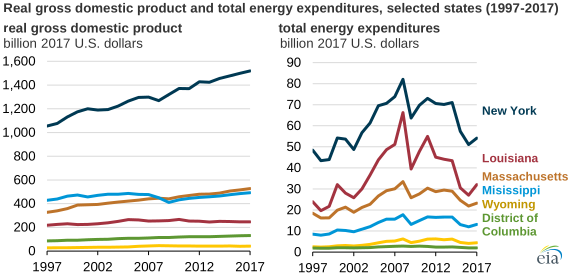
The District of Columbia, New York, and Massachusetts had the lowest levels of energy expenditures per GDP in 2017. These areas have relatively high GDP levels and rely on relatively low energy-intensive industries, such as finance and technology. These factors override relatively higher total energy consumption and average energy prices.
New York has had the lowest energy expenditures per GDP of any state for nearly every year since 1997, and the District of Columbia’s energy expenditures per GDP were even lower during the same period. The transportation sector, not the industrial sector, accounts for the largest share of New York’s energy expenditures. The commercial sector, which includes government and business energy activities, accounts for the largest share of the District of Columbia’s energy expenditures.
Principal contributor: Mickey Francis