Wind and solar in March accounted for 10% of U.S. electricity generation for first time
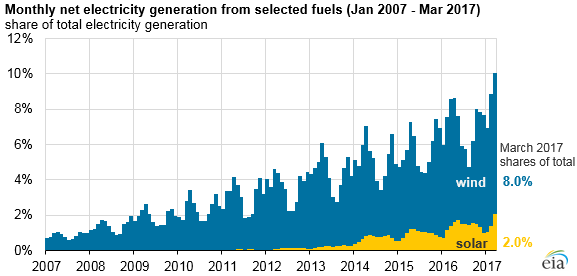
For the first time, monthly electricity generation from wind and solar (including utility-scale plants and small-scale systems) exceeded 10% of total electricity generation in the United States, based on March data in EIA’s Electric Power Monthly. Electricity generation from both of these energy sources has grown with increases in wind and solar generating capacity. On an annual basis, wind and solar made up 7% of total U.S. electric generation in 2016.
Electricity generation from wind and solar follows seasonal patterns that reflect the seasonal availability of wind and sunshine. Within the United States, wind patterns vary based on geography. For example, wind-powered generating units in Texas, Oklahoma, and nearby states often have their highest output in spring months, while wind-powered generators in California are more likely to have their highest output in summer months.
Monthly solar output is highest in the summer months, regardless of location, because of the greater number of daylight hours. About half of all utility-scale solar power plants in the United States use some form of sun-tracking technology to improve their seasonal output.
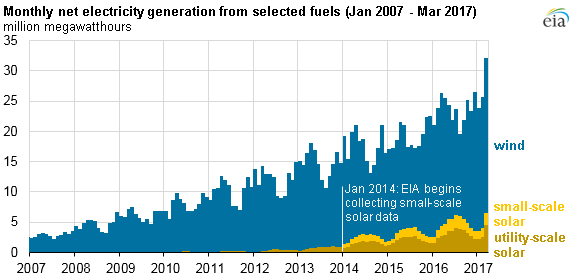
Based on seasonal patterns in recent years, electricity generation from wind and solar will probably exceed 10% of total U.S. generation again in April 2017, then fall to less than 10% in the summer months. Since 2014, when EIA first began estimating monthly, state-level electricity generation from small-scale solar photovoltaic systems, combined wind and solar generation has reached its highest level in either the spring or fall. Because these seasons are times of generally low electricity demand, combined wind and solar generation also reached its highest share of the U.S. total during these times of year.
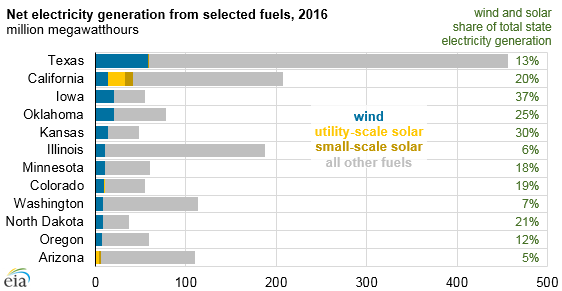
Based on annual data for 2016, Texas accounted for the largest total amount of wind and solar electricity generation. Nearly all of this generation was from wind, as Texas generates more wind energy than any other state. As a share of the state’s total electricity generation, wind and solar output was highest in Iowa, where wind and solar made up 37% of electricity generation in 2016. In addition to Iowa, wind and solar provided at least 20% of 2016 electricity generation in six other states.
In almost all states, wind makes up a larger share of the state’s total electricity generation than solar. Among the top dozen states, only California and Arizona had more solar generation than wind in 2016. Three states in the top 12—Iowa, Kansas, and North Dakota—had no generation from utility-scale solar plants in 2016 and relatively little output from small-scale solar photovoltaic systems.
More information about state electricity generation by energy source is available in EIA’s Electric Power Monthly and Electricity Data Browser.
Principal contributor: Owen Comstock
Tags: electricity, generation, renewables, solar, states, wind