Northeast natural gas spot prices particularly sensitive to temperature swings
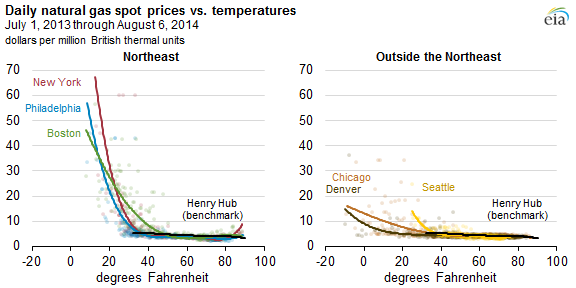
Note: Lines represent best-fit fourth-order polynomial equations based on a scatter plot of temperatures observed at major airports in each city, and prices at nearby market hubs. Best-fit lines do not extend to cover the entire range of all temperature and price observations. Spot prices are by delivery date.
Natural gas spot prices fluctuate throughout the year in response to several factors, including weather, production levels, supply interruptions, pipeline constraints, inventory levels, and the availability of other energy sources. Temperature changes, more than any other factor, most frequently correlate with natural gas spot price movements. Natural gas demand and, in turn, natural gas prices in the spot market, will generally rise as temperatures move further away from 60 degrees Fahrenheit, as more natural gas is needed for space heating as temperatures cool and for power generation as temperatures warm.
However, this relationship takes different forms at various locations throughout the United States. The impact of extreme cold is particularly large, reflecting high usage for heating combined with infrastructure constraints in some markets. In the Northeast, prices are particularly sensitive to temperature variations, rising by more than other regions as temperatures cool and high demand exacerbates pipeline constraints, as well as when temperatures warm and rising natural gas demand from electric generators can strain pipelines. Conversely, during more temperate days in the spring and fall, when pipeline capacity is generally sufficient to meet lower demand, the proximity of northeastern hubs to increasing Marcellus Region production results in prices that are lower than those in other parts of the United States.
Source: U.S. Energy Information Administration, with data from Bloomberg and SNL Energy
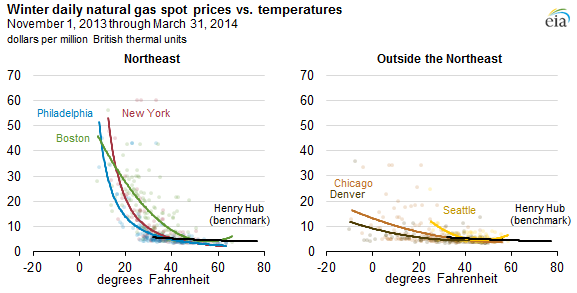
Note: Lines for Henry Hub (benchmark) and Boston represent best-fit second-order polynomial equations based on a scatter plot of temperatures observed at major airports in each city, and prices at nearby market hubs. New York and Philadelphia's best fit lines represent an exponential equation, which produced a line that better fit the data points. Best-fit lines do not extend to cover the entire range of all temperature and price observations. Spot prices are by delivery date.
- During cold winter months, average temperatures in the Northeast can drop below 20 degrees Fahrenheit, as occurred in January 2014.
- On these days, natural gas spot prices reached record levels, rising to more than $75 per million British thermal units (MMBtu) at Algonquin Citygate, $90/MMBtu at Tetco-M3, and $120/MMBtu at Transco Zone 6-New York.
- In 2009, 52% of households in the Northeast U.S. Census Region used natural gas-fired heaters as their main home heating equipment. This share was below the percentage of households relying primarily on natural gas-fired equipment for home heating in the Midwest (69%) and West (55%).
- However, northeastern cities differ from cities in the Midwest and West in that, on days of high demand from residential and commercial consumers that rely on firm capacity from local distribution companies, the amount of capacity available to spot market consumers—largely electric generators—becomes strained, causing much more significant price spikes.
- The Northeast is also relatively more reliant on natural gas-fired generation than the West or Midwest. In 2013, gas-fired electricity generation accounted for 33% of net power sector generation in the Northeast, versus 8% in the Midwest and 29% in the West.
- In Chicago and Denver, average daily temperatures dropped far lower than in the Northeast last winter, to almost -10 degrees. Natural gas spot prices in these cities increased on the coldest days, but they did not climb significantly higher than $30/MMBtu.
- Chicago and Denver generally have sufficient pipeline connectivity to sources in Texas, the Gulf Coast, the Rockies, and Canada to meet spot market demand, while also satisfying demand from firm-service customers.
Source: U.S. Energy Information Administration, with data from Bloomberg and SNL Energy
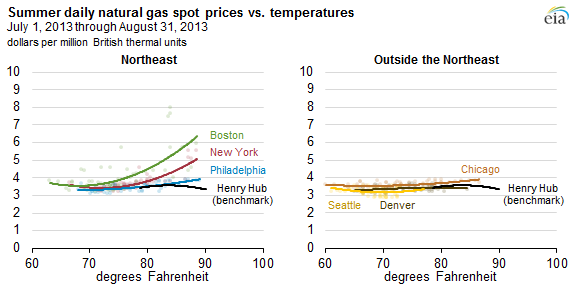
Note: Lines represent best-fit second-order polynomial equations based on a scatter plot of temperatures observed at major airports in each city, and prices at nearby market hubs. Best-fit lines do not extend to cover the entire range of all temperature and price observations. Spot prices are by delivery date.
- During warm summer months, the largest increase in natural gas consumption comes from the electric power sector, as the need for cooling in homes and buildings increases demand for power generation.
- As temperatures approached 90 degrees in New York and New England during the warm summer months of July and August last year, natural gas spot prices surpassed $5 per million British thermal units (MMBtu) at the Algonquin Citygate hub serving Boston area consumers and at the Transco Zone 6-New York hub. However, prices remained below $5/MMBtu at the national benchmark Henry Hub in Erath, Louisiana, and at the Tetco-M3 Mid-Atlantic hub near Philadelphia.
- The northeastern United States is increasingly reliant on natural gas for power generation. In 2013, natural gas-fired power provided 44% of net electric power sector generation in the New England U.S. Census Division, versus a 26% share for all of the United States, according to Electric Power Monthly data.
Source: U.S. Energy Information Administration, with data from Bloomberg and SNL Energy
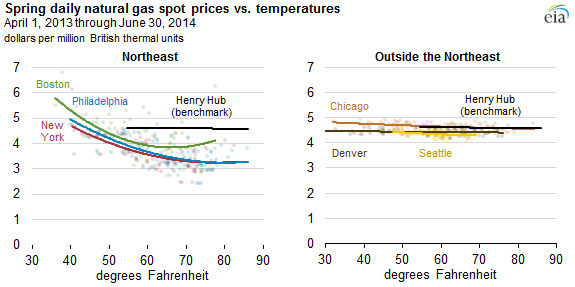
Note: Market hubs by city are as follows: New York—Transco Zone 6-New York, Boston—Algonquin Citygate, Philadelphia—Tetco-M3, New Orleans—Henry Hub. Temperature data comes from major airports in each city. Spot prices are by delivery date.
- During spring days in late April, May, and early June, average daily natural gas prices decrease as temperatures rise from winter lows into a mid-range area—generally between 40 and 80 degrees. Temperatures and gas prices on these days are very similar to those seen during the fall months of September and October. As a result, these two months are not separately detailed.
- Demand for natural gas on the East Coast is generally at its lowest level when average daily temperatures are at or near 60 degrees. Natural gas spot prices are also lowest on these days, because low residential and commercial demand allows a large amount of pipeline capacity to be available for spot market consumers, but temperatures are cool enough to keep demand for electric generation relatively low.
- The constraints resulting from limited pipeline takeaway capacity do not have an effect on the ability to move abundant and relatively inexpensive Marcellus natural gas supply to eastern consumers on these days.
Principal contributor: Mike Ford
Tags: natural gas, spot prices, weather