In the News:
Average U.S. natural gas bills expected to decrease this winter
In the 2023 Winter Fuels Outlook supplement to our October Short-Term Energy Outlook (STEO), we expect average U.S. natural gas bills for consumers that heat their homes primarily with natural gas to be lower this winter in all regions compared with last winter. A decrease in natural gas prices across the country is the main driver of the decrease in residential winter natural gas expenditures. The wholesale U.S. natural gas spot price at the national benchmark Henry Hub started last winter heating season (November–March) averaging $5.66 per thousand cubic feet (Mcf) in November 2022. This November, we expect the Henry Hub price to average $3.12/Mcf, which is 45% ($2.54/Mcf) lower than last year.
Natural gas is the primary heating fuel for 46% of U.S. homes, according to the U.S. Census Bureau’s 2022 American Community Survey. The retail price of natural gas and the amount of natural gas consumed determine how much consumers will pay.
Last winter, residential retail prices of natural gas were higher than they have been in the previous 10 winters (winter 2012–2013 to winter 2021–2022), averaging $14.85/Mcf. Residential retail prices of natural gas reached multiyear highs throughout 2022, driven by the relatively high Henry Hub wholesale price of natural gas, which averaged $6.68/Mcf in 2022, a 65% increase from the 2021 average. The Henry Hub price has been much lower in 2023, averaging under $3.00/Mcf in every month except for January. The lower wholesale natural gas prices this year contribute to our expectation of a 21% ($3.16/Mcf) decline in U.S. average residential retail prices for the 2023–2024 winter.
Winter natural gas expenditures decline the most in the West (30%) compared with other regions because we are forecasting lower consumption of natural gas in that region in addition to lower prices. Below-normal temperatures in the West last winter led to the highest winter residential consumption of natural gas in the past 10 winters (winter 2013–2014 to winter 2022–2023). This winter, we’re forecasting consumption in the West to be closer to the 10-year average, decreasing from the relatively high consumption last winter. We expect consumption in regions other than the West to increase in January 2024 and February 2024 compared with last year, when a warmer-than-normal January and February led to lower-than-average consumption of natural gas for heating.
Market Highlights:
(For the week ending Wednesday, October 11, 2023)Prices
- Henry Hub spot price: The Henry Hub spot price rose 27 cents from $2.91 per million British thermal units (MMBtu) last Wednesday to $3.18/MMBtu yesterday. The Henry Hub spot price rose above $3.00/MMBtu for the first time since January of this year.
- Henry Hub futures price: The price of the November 2023 NYMEX contract increased 41.5 cents, from $2.962/MMBtu last Wednesday to $3.377/MMBtu yesterday. The price of the 12-month strip averaging November 2023 through October 2024 futures contracts climbed 26.9 cents to $3.529/MMBtu. The NYMEX futures price at the Henry Hub has been steadily increasing since September 21 when the front month contract settled at $2.61/MMBtu.
- Select regional spot prices: Natural gas spot price changes at major pricing hubs were mixed this report week (Wednesday, October 4, to Wednesday, October 11), ranging from a decrease of $0.58/MMBtu at the Waha Hub in West Texas to an increase of $1.44/MMBtu at SoCal Citygate.
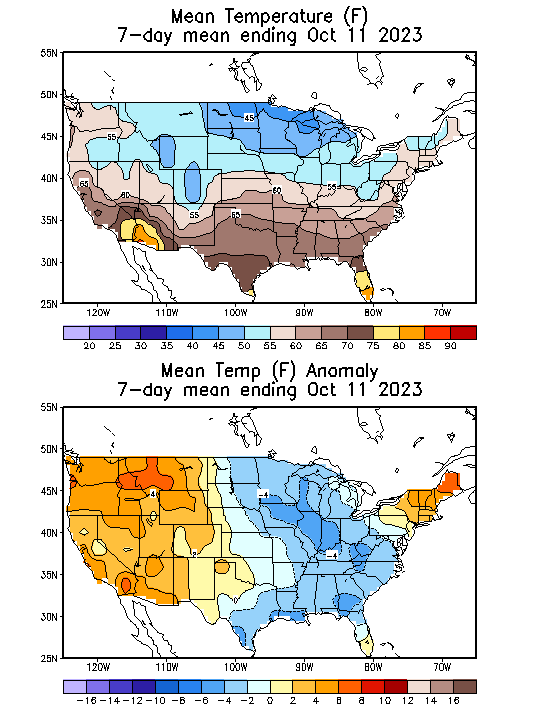
- Price changes were mixed from the Rocky Mountains to the West Coast this week. The price at the Opal Hub in southwest Wyoming fell 38 cents from $2.74/MMBtu last Wednesday to $2.36/MMBtu yesterday. The price at Malin, Oregon, the northern delivery point into the PG&E service territory, fell 54 cents from $3.00/MMBtu last Wednesday to $2.46/MMBtu yesterday, and the price at PG&E Citygate in Northern California fell 45 cents, down from $4.86/MMBtu last Wednesday to $4.41/MMBtu yesterday. Meanwhile, the price at Northwest Sumas on the Canada-Washington border rose 33 cents from $2.01/MMBtu last Wednesday to $2.34/MMBtu yesterday, and the price at SoCal Citygate in Southern California increased $1.44 from $7.04/MMBtu last Wednesday to $8.48/MMBtu yesterday. In California, natural gas consumption in the electric power sector increased 36% (0.6 billion cubic feet per day [Bcf/d]) this week, according to S&P Global Commodity Insights. Temperatures in the Riverside Area, east of Los Angeles, averaged 77°F this week, 6°F above normal, resulting in 83 cooling degree days (CDD), 55 more CDDs than last week and 39 more than normal. The Diablo Canyon nuclear facility in San Luis Obispo, California, has been operating at approximately 50% of capacity since the beginning of October and the Palo Verde nuclear facility near Tonapah, Arizona, has been operating at approximately 67% of capacity since October 7. Natural gas consumption in the electric power sector increased to make up for some of this lost nuclear-generating capacity.
- In Texas, the price at the Waha Hub, which is located near Permian Basin production activities, fell 58 cents this report week, from $2.46/MMBtu last Wednesday to $1.88/MMBtu yesterday. The Waha Hub traded $1.30 below the Henry Hub price yesterday, compared with last Wednesday when it traded 45 cents below the Henry Hub price. The Henry Hub price rose $0.27/MMBtu this week, also contributing to the wider price differential between the Waha Hub and Henry Hub. At the Houston Ship Channel, the price decreased 15 cents, from $2.68/MMBtu last Wednesday to $2.53/MMBtu yesterday. Natural gas consumption in the electric power sector in Texas decreased 32% (1.9 Bcf/d) this week, as temperatures fell compared with last week. Temperatures in the Houston Area averaged 71°F this week, down from 82°F the previous week. Lower average temperatures compared with last week resulted in 41 CDDs, 83 fewer CDDs than last week and 27 fewer than normal.
- International futures prices: International natural gas futures price changes were mixed this report week. According to Bloomberg Finance, L.P., weekly average front-month futures prices for liquefied natural gas (LNG) cargoes in East Asia decreased 26 cents to a weekly average of $14.18/MMBtu. Natural gas futures for delivery at the Title Transfer Facility (TTF) in the Netherlands increased $1.17 to a weekly average of $13.28/MMBtu. In the same week last year (week ending October 12, 2022), the prices were $34.81/MMBtu in East Asia and $45.83/MMBtu at TTF.
- Natural gas plant liquids (NGPL) prices: The natural gas plant liquids composite price at Mont Belvieu, Texas, fell by 29 cents/MMBtu, averaging $7.15/MMBtu for the week ending October 11. Weekly average ethane prices remained relatively unchanged, while weekly average natural gas prices at the Houston Ship Channel rose 5% week over week. The ethane premium to natural gas fell 6%. Ethylene spot prices rose 1%, and the ethylene premium to ethane rose 2%. The average weekly propane price fell 4%, while the Brent crude oil price fell 6%. The propane discount relative to crude oil fell 8%. The normal butane price fell 8%, the isobutane price fell 7%, and the natural gasoline price fell 5%.
Daily spot prices by region are available on the EIA website.
Supply and Demand
- Supply: According to data from S&P Global Commodity Insights, the average total supply of natural gas rose by 1.1% (1.1 Bcf/d) compared with the previous report week, averaging 106.9 Bcf/d. Dry natural gas production increased by 0.7% (0.7 Bcf/d) to an average 101.3 Bcf/d, and average net imports from Canada increased by 8.4% (0.4 Bcf/d) from last week.
- Demand: Total U.S. consumption of natural gas rose by 1.8% (1.3 Bcf/d) compared with the previous report week, according to data from S&P Global Commodity Insights. Natural gas consumed for power generation declined by 11.9% (4.4 Bcf/d) week over week. Industrial sector consumption increased by 3.5% (0.8 Bcf/d), and residential and commercial sector consumption increased by 51.2% (4.9 Bcf/d) as cooler temperatures moved across much of the country. Natural gas exports to Mexico decreased 3.3% (0.2 Bcf/d). Natural gas deliveries to U.S. LNG export facilities (LNG pipeline receipts) averaged 12.7 Bcf/d, or 0.3 Bcf/d higher than last week.
Liquefied Natural Gas (LNG)
- Pipeline receipts: Average natural gas deliveries to U.S. LNG export terminals increased by 2.0% (0.3 Bcf/d) week over week, averaging 12.7 Bcf/d, according to data from S&P Global Commodity Insights. Natural gas deliveries to terminals in South Louisiana increased by 4.9% (0.4 Bcf/d) to 8.6 Bcf/d, while deliveries to terminals in South Texas decreased by 4.4% (0.2 Bcf/d) to 3.8 Bcf/d. Natural gas deliveries to terminals outside the Gulf Coast were essentially unchanged at 0.3 Bcf/d. The Cove Point LNG terminal in Maryland continues to be offline because of annual maintenance.
- Vessels departing U.S. ports: Twenty LNG vessels (eight from Sabine Pass; three each from Cameron, Corpus Christi, and Freeport; two from Calcasieu Pass; and one from Elba Island) with a combined LNG-carrying capacity of 73 Bcf departed the United States between October 5 and October 11, according to shipping data provided by Bloomberg Finance, L.P.
Rig Count
- According to Baker Hughes, for the week ending Tuesday, October 3, the natural gas rig count increased by 2 from a week ago to 118 rigs. The Permian added three rigs, while the Eagle Ford dropped one rig. The number of oil-directed rigs decreased by 5 from a week ago to 497 rigs. The Eagle Ford added two rigs, the Granite Wash added one rig, the Permian dropped six rigs, the Williston dropped one rig, and one rig was dropped among unidentified producing regions. The last time the oil-directed rig count was below 500 was in February 2022. The total rig count, which includes 4 miscellaneous rigs, stands at 619 rigs.
Storage
- Net injections into storage totaled 84 Bcf for the week ending October 6, compared with the five-year (2018–2022) average net injections of 93 Bcf and last year's net injections of 125 Bcf during the same week. Working natural gas stocks totaled 3,529 Bcf, which is 163 Bcf (5%) more than the five-year average and 316 Bcf (10%) more than last year at this time.
- According to The Desk survey of natural gas analysts, estimates of the weekly net change to working natural gas stocks ranged from net injections of 77 Bcf to 105 Bcf, with a median estimate of 89 Bcf.
- The average rate of injections into storage is 7% lower than the five-year average so far in the refill season (April through October). If the rate of injections into storage matched the five-year average of 9.1 Bcf/d for the remainder of the refill season, the total inventory would be 3,758 Bcf on October 31, which is 163 Bcf higher than the five-year average of 3,595 Bcf for that time of year.
See also:
Top Data source: U.S. Energy Information Administration, Short-Term Energy Outlook (STEO), Winter Fuels Outlook
Note: Winter is November 1 to March 31.
 Data source: U.S. Energy Information Administration, Short-Term Energy Outlook (STEO), Winter Fuels Outlook
Note: Winter is November 1 to March 31.
 Data source: U.S. Energy Information Administration, Short-Term Energy Outlook (STEO), Winter Fuels Outlook
Note: Winter is November 1 to March 31.

| Spot Prices ($/MMBtu) | Thu, 05-Oct |
Fri, 06-Oct |
Mon, 09-Oct |
Tue, 10-Oct |
Wed, 11-Oct |
|---|---|---|---|---|---|
| Henry Hub |
2.94 |
3.15 |
3.30 |
3.30 |
3.18 |
| New York |
1.18 |
0.95 |
1.29 |
1.32 |
1.35 |
| Chicago |
2.57 |
2.61 |
2.53 |
2.54 |
2.41 |
| Cal. Comp. Avg.* |
3.80 |
3.81 |
3.78 |
3.80 |
3.13 |
| Futures ($/MMBtu) | |||||
| November contract | 3.166 |
3.338 |
3.376 |
3.382 |
3.377 |
| December contract |
3.511 |
3.641 |
3.631 |
3.659 |
3.658 |
| *Avg. of NGI's reported prices for: Malin, PG&E Citygate, and Southern California Border Avg. | |||||
| Data source: NGI's Daily Gas Price Index | |||||


| U.S. natural gas supply - Gas Week: (10/5/23 - 10/11/23) | |||
|---|---|---|---|
Average daily values (billion cubic feet) |
|||
this week |
last week |
last year |
|
| Marketed production | 114.6 |
113.9 |
114.8 |
| Dry production | 101.3 |
100.6 |
102.0 |
| Net Canada imports | 5.5 |
5.1 |
5.4 |
| LNG pipeline deliveries | 0.1 |
0.1 |
0.1 |
| Total supply | 106.9 |
105.8 |
107.4 |
|
Data source: S&P Global Commodity Insights | |||
| U.S. natural gas consumption - Gas Week: (10/5/23 - 10/11/23) | |||
|---|---|---|---|
Average daily values (billion cubic feet) |
|||
this week |
last week |
last year |
|
| U.S. consumption | 69.9 |
68.6 |
66.6 |
| Power | 32.7 |
37.2 |
31.5 |
| Industrial | 22.6 |
21.8 |
21.9 |
| Residential/commercial | 14.5 |
9.6 |
13.2 |
| Mexico exports | 6.4 |
6.6 |
5.5 |
| Pipeline fuel use/losses | 6.8 |
6.8 |
6.7 |
| LNG pipeline receipts | 12.7 |
12.5 |
10.8 |
| Total demand | 95.8 |
94.5 |
89.6 |
|
Data source: S&P Global Commodity Insights | |||


| Rigs | |||
|---|---|---|---|
Tue, October 03, 2023 |
Change from |
||
last week |
last year |
||
| Oil rigs | 497 |
-1.0% |
-17.4% |
| Natural gas rigs | 118 |
1.7% |
-25.3% |
| Note: Excludes any miscellaneous rigs | |||
| Rig numbers by type | |||
|---|---|---|---|
Tue, October 03, 2023 |
Change from |
||
last week |
last year |
||
| Vertical | 13 |
-13.3% |
-43.5% |
| Horizontal | 553 |
0.0% |
-20.8% |
| Directional | 53 |
-3.6% |
29.3% |
| Data source: Baker Hughes Company | |||
| Working gas in underground storage | ||||
|---|---|---|---|---|
Stocks billion cubic feet (Bcf) |
||||
| Region | 2023-10-06 |
2023-09-29 |
change |
|
| East | 874 |
847 |
27 |
|
| Midwest | 1,021 |
991 |
30 |
|
| Mountain | 244 |
239 |
5 |
|
| Pacific | 278 |
278 |
0 |
|
| South Central | 1,112 |
1,090 |
22 |
|
| Total | 3,529 |
3,445 |
84 |
|
|
Data source: U.S. Energy Information Administration Form EIA-912, Weekly Underground Natural Gas Storage Report
Note: Totals may not equal sum of components because of independent rounding. | ||||
| Working gas in underground storage | |||||
|---|---|---|---|---|---|
Historical comparisons |
|||||
Year ago (10/6/22) |
5-year average (2018-2022) |
||||
| Region | Stocks (Bcf) |
% change |
Stocks (Bcf) |
% change |
|
| East | 778 |
12.3 |
832 |
5.0 |
|
| Midwest | 947 |
7.8 |
981 |
4.1 |
|
| Mountain | 189 |
29.1 |
204 |
19.6 |
|
| Pacific | 249 |
11.6 |
275 |
1.1 |
|
| South Central | 1,050 |
5.9 |
1,074 |
3.5 |
|
| Total | 3,213 |
9.8 |
3,366 |
4.8 |
|
| Data source: U.S. Energy Information Administration Form EIA-912, Weekly Underground Natural Gas Storage Report
Note: Totals may not equal sum of components because of independent rounding. |
|||||
| Temperature – heating & cooling degree days (week ending Oct 05) | ||||||||
|---|---|---|---|---|---|---|---|---|
HDDs |
CDDs |
|||||||
| Region | Current total |
Deviation from normal |
Deviation from last year |
Current total |
Deviation from normal |
Deviation from last year |
||
| New England | 33 |
-36 |
-54 |
2 |
2 |
2 |
||
| Middle Atlantic | 20 |
-37 |
-64 |
5 |
1 |
5 |
||
| E N Central | 10 |
-50 |
-61 |
21 |
17 |
21 |
||
| W N Central | 9 |
-49 |
-33 |
45 |
38 |
44 |
||
| South Atlantic | 4 |
-22 |
-47 |
47 |
6 |
28 |
||
| E S Central | 1 |
-24 |
-41 |
46 |
21 |
43 |
||
| W S Central | 0 |
-6 |
-10 |
88 |
38 |
54 |
||
| Mountain | 53 |
-8 |
13 |
16 |
-8 |
-9 |
||
| Pacific | 30 |
10 |
26 |
9 |
-8 |
-14 |
||
| United States | 17 |
-26 |
-31 |
31 |
10 |
18 |
||
|
Data source: National Oceanic and Atmospheric Administration Note: HDDs=heating degree days; CDDs=cooling degree days | ||||||||
Average temperature (°F)
7-day mean ending Oct 05, 2023

Data source: National Oceanic and Atmospheric Administration
Deviation between average and normal temperature (°F)
7-day mean ending Oct 05, 2023
Data source: National Oceanic and Atmospheric Administration
