In the News:
EIA expects below-average U.S. natural gas inventories entering the winter heating season
In our August 2021 Short-Term Energy Outlook (STEO), we forecast U.S. inventories of natural gas will reach 3,592 billion cubic feet (Bcf) by November 1, or the beginning of the winter heating season, which will be 159 Bcf below the previous five year average (2016-2020). Above-average withdrawals of natural gas from storage in the 2020-2021 winter heating season and below-average injections into storage this summer thus far contributed to our forecast of below-average inventories of natural gas, along with relatively flat dry natural gas production and high exports.
U.S. production of dry natural gas has remained relatively flat, averaging 91.5 Bcf/d so far in 2021 (January–July), 0.4 Bcf/d below the same period in 2020. Production in January 2021 and July 2021 both averaged 92.5 Bcf/d. Production of natural gas declined in February 2021 by more than 6.5 Bcf/d because of extremely cold weather and well-freeze offs, but increased to 92.0 Bcf/d the next month.
U.S. exports of liquefied natural gas (LNG) reached record levels in in the first half of 2021, because of additions in LNG export capacity and strong international demand which resulted in rising international natural gas and LNG prices. In 2020, U.S. LNG exports averaged 6.5 Bcf/d amid low global natural gas demand during the onset of the COVID-19 pandemic. U.S. LNG exports averaged 9.4 Bcf/d so far this year, and we forecast that LNG exports will average 9.5 Bcf/d in 2021.
Pipeline exports of natural gas have also increased in 2021 compared with 2020, driven by an increase in exports to Mexico. U.S. pipeline exports of natural gas have averaged 8.5 Bcf/d so far in 2021, compared with 7.9 Bcf/d in 2020. Pipeline exports to Mexico grew 13.6% to 5.7 Bcf/d for January-May 2021 (the most recent month for which regional export data are available) compared with the same time period in 2020, while exports to Canada remained flat. We forecast that U.S. pipeline exports of natural gas will average 8.9 Bcf/d for all of 2021.
The high level of U.S. exports in 2021 combined with the relatively flat production have contributed to below-average injections of natural gas to storage this summer leading up to the winter heating season. So far this injection season (April 1-October 31), U.S. inventories of natural gas have grown by 960 Bcf, 14% less than the five-year average injection from April to July. In June 2021, the hottest June on record for the United States, natural gas inventories grew by 207 Bcf, 120 Bcf less than the five-year average inventory build for June. From May to June, U.S. consumption of natural gas increased 4.2 Bcf/d, or 6.2% because of an increase in electric power sector consumption in response to the hot weather.
Overview:
(For the week ending Wednesday, August 11, 2021)
- Natural gas spot price movements were mixed this report week (Wednesday, August 4, to Wednesday, August 11). The Henry Hub spot price fell from $4.12 per million British thermal units (MMBtu) last Wednesday to $4.07/MMBtu yesterday.
- The price of the September 2021 NYMEX contract decreased 10¢, from $4.158/MMBtu last Wednesday to $4.059/MMBtu yesterday. The price of the 12-month strip averaging September 2021 through August 2022 futures contracts declined 4¢/MMBtu to $3.819/MMBtu.
- The net injections to working gas totaled 49 billion cubic feet (Bcf) for the week ending August 6. Working natural gas stocks totaled 2,776 Bcf, which is 16% lower than the year-ago level and 6% lower than the five-year (2016–2020) average for this week.
- The composite price for natural gas plant liquids at Mont Belvieu, Texas, was relatively flat, falling by 3¢/MMBtu, or 0.3%, week over week and averaging $9.61/MMBtu for the week ending August 11. Propane and isobutane prices decreased by 1% while normal butane prices remained relatively unchanged. These declines were all smaller than the decline in Brent crude oil prices, which decreased by 4% on average week over week, reflecting continuing high demand for propane and butanes from the domestic and international markets. Natural gasoline prices, which are most closely correlated with crude oil prices, fell by 2%. Ethane prices rose 4% following a 6% rise in ethylene prices. Natural gas prices at the Houston Ship Channel rose 3%, so ethane’s premium to natural gas measured on a heat-content parity increased by 7%.
- According to Baker Hughes, for the week ending Tuesday, August 3, the natural gas rig count remained flat at 103. The number of oil-directed rigs rose by 2 to 387; losses in the Monterey Basin in California somewhat offset the gains reported in the Anadarko Basin in Oklahoma, the Permian Basin in New Mexico, and in Wyoming. The number of horizontal-drilling rigs continues to increase, reaching 449 this report week—the highest total since mid-April 2020. The number of vertical and directional drilling rigs has remained relatively flat and now accounts for 8.6% of all rigs, down from 15.7% in mid-September 2020. The total rig count increased by 3, and it now stands at 491.
Prices/Supply/Demand:
Gulf Coast prices fall on flat domestic demand and reduced deliveries to liquefied natural gas (LNG) export terminals. This report week (Wednesday, August 4, to Wednesday, August 11), the Henry Hub spot price fell 5¢ from $4.12/MMBtu last Wednesday to $4.07/MMBtu yesterday. IHS Markit estimates demand in South Louisiana, where the Henry Hub is located, declined on average by more than 650 million cubic feet per day (MMcf/d) this week, and declines in deliveries to LNG terminals accounted for close to all of this decline. Some of the decline in deliveries to LNG terminals may be attributed to maintenance on the Creole Trail pipeline, which serves the Sabine Pass LNG terminal. Cheniere, the pipeline operator, reported maintenance (notice ID 569) on the Gillis Compressor Station, which reduced flows to the terminal by approximately 600 MMcf/d beginning at midnight CDT on August 10 and ending at 9:00 a.m. on August 11.
Prices in the Midwest decline as pipeline inflows into the region rise by more than in-region demand. At the Chicago Citygate, the price decreased 7¢ from $4.02/MMBtu last Wednesday to a weekly low of $3.95/MMBtu yesterday. The price at the Chicago Citygate reached a weekly high of $4.08/MMBtu on Thursday. Temperatures in the Midwest rose week over week and were approximately 8°F above average near the end of the report week. The elevated prices earlier in the report week drew additional natural gas supplies from the Lower Midcontinent (primarily Oklahoma). IHS Markit reports Lower Midcontinent net flows into the Midwest increased by approximately 600 MMcf/d week over week, while shipments south to Texas decreased by a similar amount.
Prices in California decline but remain at highly elevated levels compared with mid-August last year and two years ago. The price at PG&E Citygate in Northern California fell 15¢, down from $5.59/MMBtu last Wednesday to a weekly low of $5.44/MMBtu yesterday. Temperatures in the state decreased somewhat this report week relative to last week, resulting in lower electricity demand. IHS Markit reports natural gas demand for power generation in California declined week over week on average by 0.4 billion cubic feet per day (Bcf/d), but it remains elevated at more than 0.5 Bcf/d above the demand level for the same week last year. Prices at the PG&E Citygate have averaged over $5.50/MMBtu this month through the 11th, the highest levels for the first half of August since 2008. Last Thursday the California Department of Water Resources (DWR) announced the idling of the Hyatt Powerplant due to low water levels on Lake Oroville. The electricity generation capacity of the hydroelectric plant, which has pumped-storage capability, will mostly be replaced with natural gas peaking units and electricity imports from other states. Most reservoirs in California are at below-average levels as a result of a historic drought in the state. Lake Shasta, the state’s largest reservoir, is now at 44% of its historical average level and just 30% of its design capacity.
The price at SoCal Citygate in Southern California decreased 47¢ from a weekly high of $7.95/MMBtu last Wednesday to a weekly low of $7.48/MMBtu yesterday. Temperatures in Southern California returned to near-average levels this week, after remaining elevated through the previous report week. Daily high temperatures at Riverside, inland from Los Angeles, were reported at over 100°F at the end of last report week, up to 9°F above average, but they remained close to average this week.
Northeast prices rise as high temperatures result in increased electricity demand for air conditioning. At the Algonquin Citygate, which serves Boston-area consumers, the price went up $1.07 from $3.83/MMBtu last Wednesday to a weekly high of $4.90/MMBtu yesterday. At the Transcontinental Pipeline Zone 6 trading point for New York City, prices also reached a weekly high yesterday, rising 34¢ from $3.75/MMBtu last Wednesday to $4.09/MMBtu yesterday. According to data from IHS Markit, natural gas consumed in the electric power sector in the Northeast increased 1.4 Bcf/d this week compared with last week. The National Weather Service put excessive heat warnings into effect this week for New York and areas of New England in Connecticut, Massachusetts, and Rhode Island; heat index values up to 105°F are possible.
Prices in the Appalachian Basin production region rise in response to increased demand in the Northeast. The Tennessee Zone 4 Marcellus spot price increased 3¢ from $3.61/MMBtu last Wednesday to $3.64/MMBtu yesterday. Prices at the Tennessee Zone 4 hub reached a high of $3.72/MMBtu on Monday. The price at Eastern Gas in southwest Pennsylvania rose 6¢ from $3.65/MMBtu last Wednesday to $3.71/MMBtu yesterday, after reaching a weekly high of $3.76/MMBtu on Thursday.
Permian prices increase slightly as pipeline maintenance concludes and new pipeline capacity ramps up. The price at the Waha Hub in West Texas, which is located near Permian Basin production activities, increased 3¢/MMBtu from $3.82/MMBtu last Wednesday to $3.85/MMBtu yesterday, after reaching a weekly high of $3.98 on Monday. The Permian Highway Pipeline (PHP) returned to full capacity on August 7, after maintenance on the pipeline resulted in reduced flows by as much as 0.9 Bcf/d. The end of maintenance on PHP, along with the start-up activities on the Whistler Pipeline, which has a design capacity to transport about 2 Bcf/d of natural gas from the Permian Basin to the Texas Gulf Coast, has resulted in a decrease in the discount at the Waha Hub relative to the Henry Hub, which fell from 30¢/MMBtu last Wednesday to 22¢/MMBtu yesterday.
U.S. total supply declines for the second week in a row, as dry natural gas production and imports decline. According to data from IHS Markit, the average total supply of natural gas fell by 0.3%, or 0.3 Bcf/d, compared with the previous report week. Dry natural gas production declined 0.1% (0.1 Bcf/d), net natural gas imports from Canada dropped 4.1% (0.2 Bcf/d), and sendout from LNG import terminals decreased 1.6% to 0.06 Bcf/d.
U.S. natural gas consumption rises in most sectors, offset somewhat by declines in the industrial sector and LNG export terminal pipeline receipts. With temperatures trending slightly warmer than average over the past week, total U.S. consumption of natural gas rose by 2.3%, or 1.6 Bcf/d, compared with the previous report week, according to data from IHS Markit. Power generation and residential and commercial consumption rose by 3.2% and 5.6% (1.2 Bcf/d and 0.5 Bcf/d), respectively. Natural gas exports to Mexico increased 1.6%, or 0.1 Bcf/d. The industrial sector average volumes decreased slightly by 0.6%, or 0.1 Bcf/d, while average natural gas deliveries to U.S. LNG export facilities (LNG pipeline receipts) dropped 6.3% from last week to 9.9 Bcf/d, 0.6 Bcf/d lower than last week.
U.S. LNG exports remain the same week over week. Twenty-one LNG vessels (six from Sabine Pass, five from Freeport, four from Corpus Christi, three from Cameron, two from Cove Point, and one from Elba Island) with a combined LNG-carrying capacity of 77 Bcf departed the United States between August 5 and August 11, 2021, according to shipping data provided by Bloomberg Finance, L.P.
Storage:
The net injections into storage totaled 49 Bcf for the week ending August 6, compared with the five-year (2016–2020) average net injections of 42 Bcf and last year's net injections of 55 Bcf during the same week. Working natural gas stocks totaled 2,776 Bcf, which is 178 Bcf lower than the five-year average and 548 Bcf lower than last year at this time.
According to The Desk survey of natural gas analysts, estimates of the weekly net change to working natural gas stocks ranged from net injections of 41 Bcf to 58 Bcf, with a median estimate of 47 Bcf.
The average rate of injections into storage is 13% lower than the five-year average so far in the refill season (April through October). If the rate of injections into storage matched the five-year average of 8.9 Bcf/d for the remainder of the refill season, the total inventory would be 3,541 Bcf on October 31, which is 178 Bcf lower than the five-year average of 3,719 Bcf for that time of year.
More storage data and analysis can be found on the Natural Gas Storage Dashboard and the Weekly Natural Gas Storage Report.
See also:
 Source: U.S. Energy Information Administration, Short-Term Energy Outlook.
 Source: U.S. Energy Information Administration, Short-Term Energy Outlook.

| Spot Prices ($/MMBtu) | Thu, 05-Aug |
Fri, 06-Aug |
Mon, 09-Aug |
Tue, 10-Aug |
Wed, 11-Aug |
|---|---|---|---|---|---|
| Henry Hub |
4.18 |
4.13 |
4.16 |
4.11 |
4.07 |
| New York |
3.92 |
3.90 |
3.96 |
4.09 |
4.09 |
| Chicago |
4.08 |
4.05 |
4.04 |
3.98 |
3.95 |
| Cal. Comp. Avg.* |
5.26 |
4.85 |
5.05 |
5.12 |
5.16 |
| Futures ($/MMBtu) | |||||
| September contract | 4.140 |
4.140 |
4.060 |
4.089 |
4.059 |
| October contract |
4.148 |
4.154 |
4.075 |
4.103 |
4.071 |
| *Avg. of NGI's reported prices for: Malin, PG&E Citygate, and Southern California Border Avg. | |||||
| Source: NGI's Daily Gas Price Index | |||||


| U.S. natural gas supply - Gas Week: (8/5/21 - 8/11/21) | |||
|---|---|---|---|
Average daily values (billion cubic feet) |
|||
this week |
last week |
last year |
|
| Marketed production | 105.1 |
105.1 |
100.9 |
| Dry production | 92.9 |
93.0 |
90.2 |
| Net Canada imports | 4.9 |
5.1 |
4.5 |
| LNG pipeline deliveries | 0.1 |
0.1 |
0.1 |
| Total supply | 97.9 |
98.2 |
94.8 |
|
Source: Chart by the U.S. Energy Information Administration (EIA), based on data from IHS Markit | |||
| U.S. natural gas consumption - Gas Week: (8/5/21 - 8/11/21) | |||
|---|---|---|---|
Average daily values (billion cubic feet) |
|||
this week |
last week |
last year |
|
| U.S. consumption | 68.1 |
66.5 |
68.5 |
| Power | 38.8 |
37.6 |
39.7 |
| Industrial | 20.6 |
20.7 |
21.1 |
| Residential/commercial | 8.7 |
8.2 |
7.6 |
| Mexico exports | 6.2 |
6.1 |
5.8 |
| Pipeline fuel use/losses | 6.4 |
6.3 |
6.3 |
| LNG pipeline receipts | 9.9 |
10.5 |
4.2 |
| Total demand | 90.6 |
89.5 |
84.7 |
|
Source: Chart by the U.S. Energy Information Administration (EIA), based on data from IHS Markit | |||


| Rigs | |||
|---|---|---|---|
Tue, August 03, 2021 |
Change from |
||
last week |
last year |
||
| Oil rigs | 387 |
0.5% |
119.9% |
| Natural gas rigs | 103 |
0.0% |
49.3% |
| Note: Excludes any miscellaneous rigs | |||
| Rig numbers by type | |||
|---|---|---|---|
Tue, August 03, 2021 |
Change from |
||
last week |
last year |
||
| Vertical | 15 |
-11.8% |
25.0% |
| Horizontal | 449 |
1.6% |
112.8% |
| Directional | 27 |
-6.9% |
12.5% |
| Source: Chart by the U.S. Energy Information Administration (EIA), based on data from Baker Hughes Company | |||
| Working gas in underground storage | ||||
|---|---|---|---|---|
Stocks billion cubic feet (Bcf) |
||||
| Region | 2021-08-06 |
2021-07-30 |
change |
|
| East | 629 |
604 |
25 |
|
| Midwest | 741 |
719 |
22 |
|
| Mountain | 185 |
184 |
1 |
|
| Pacific | 241 |
244 |
-3 |
|
| South Central | 979 |
976 |
3 |
|
| Total | 2,776 |
2,727 |
49 |
|
|
Source: U.S. Energy Information Administration Form EIA-912, Weekly Underground Natural Gas Storage Report | ||||
| Working gas in underground storage | |||||
|---|---|---|---|---|---|
Historical comparisons |
|||||
Year ago (8/6/20) |
5-year average (2016-2020) |
||||
| Region | Stocks (Bcf) |
% change |
Stocks (Bcf) |
% change |
|
| East | 735 |
-14.4 |
674 |
-6.7 |
|
| Midwest | 852 |
-13.0 |
757 |
-2.1 |
|
| Mountain | 205 |
-9.8 |
187 |
-1.1 |
|
| Pacific | 314 |
-23.2 |
286 |
-15.7 |
|
| South Central | 1,218 |
-19.6 |
1,050 |
-6.8 |
|
| Total | 3,324 |
-16.5 |
2,954 |
-6.0 |
|
| Source: U.S. Energy Information Administration Form EIA-912, Weekly Underground Natural Gas Storage Report | |||||
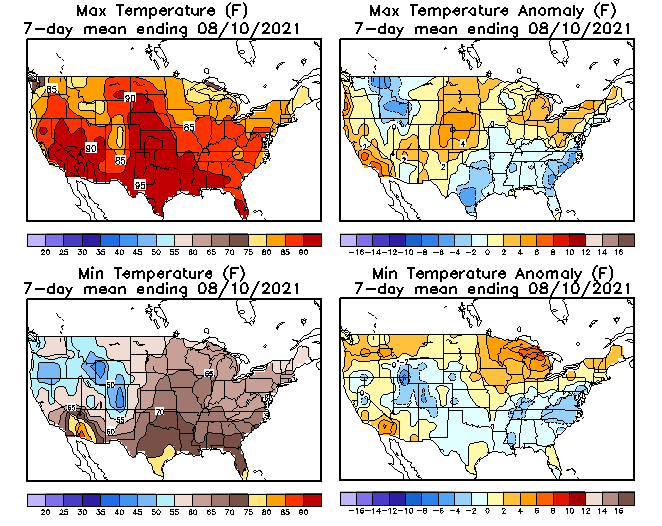
| Temperature – heating & cooling degree days (week ending Aug 05) | ||||||||
|---|---|---|---|---|---|---|---|---|
HDDs |
CDDs |
|||||||
| Region | Current total |
Deviation from normal |
Deviation from last year |
Current total |
Deviation from normal |
Deviation from last year |
||
| New England | 7 |
5 |
7 |
13 |
-31 |
-62 |
||
| Middle Atlantic | 4 |
1 |
4 |
28 |
-30 |
-52 |
||
| E N Central | 6 |
2 |
2 |
27 |
-29 |
-16 |
||
| W N Central | 3 |
0 |
-4 |
52 |
-17 |
11 |
||
| South Atlantic | 0 |
0 |
0 |
89 |
-7 |
-23 |
||
| E S Central | 0 |
0 |
0 |
83 |
-11 |
-10 |
||
| W S Central | 0 |
0 |
0 |
118 |
-7 |
1 |
||
| Mountain | 0 |
-2 |
0 |
83 |
7 |
-17 |
||
| Pacific | 0 |
-2 |
0 |
76 |
29 |
11 |
||
| United States | 2 |
0 |
1 |
64 |
-10 |
-17 |
||
|
Source: Chart by the U.S. Energy Information Administration (EIA), based on data from the National Oceanic and Atmospheric Administration Note: HDDs=heating degree days; CDDs=cooling degree days | ||||||||
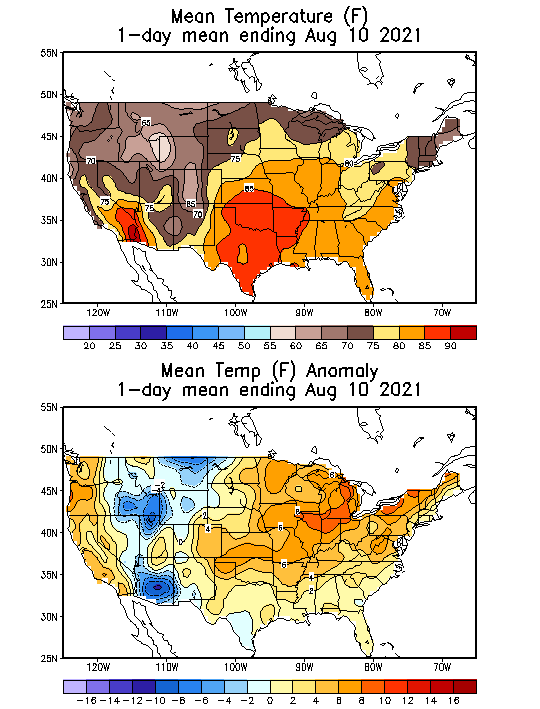
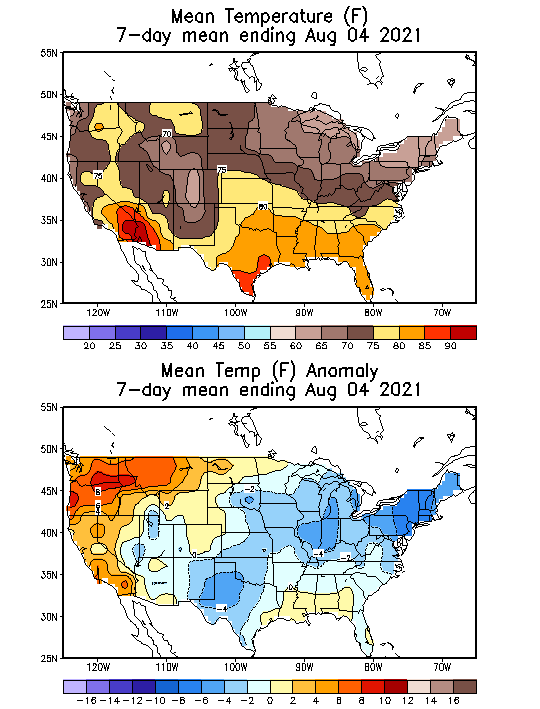
Average temperature (°F)
7-day mean ending Aug 05, 2021

Source: National Oceanic and Atmospheric Administration
Deviation between average and normal (°F)
7-day mean ending Aug 05, 2021
Source: National Oceanic and Atmospheric Administration
