In the News:
Texas Legislature Responds to Energy Market Disruptions Following Historic Winter Weather
Last February, during a winter storm of historic proportions, Texas experienced an unprecedented decline in marketed natural gas production of 186.7 billion cubic feet (Bcf), or 24.1%, compared with the prior month. This decline contributed significantly to the largest monthly decline in natural gas production on record in the Lower 48 states. This weather event caused widespread disruptions in energy supply and demand, including extended electric power blackouts in Texas. The Electric Reliability Council of Texas (ERCOT) found that weather issues were the main cause of the mechanical and equipment failures, causing about 53% of maximum unavailability of total outaged and derated capacity at the power generators. According to ERCOT, fuel limitations (defined as generator outages due to lack of fuel, contaminated fuel, fuel supply instability, low gas pressure, or less efficient alternative fuel supply), accounted for 12% of maximum unavailability of total outaged and derated capacity at the power generators.
Mechanical and equipment failure can be rooted in weather-related causes. Exposed pipeline control valves can freeze in position, and methane hydrates can form at critical points within automated control equipment as a result of cold temperatures. The inability of personnel to reach essential areas to repair pipeline, gathering system, or wellhead equipment can also be problematic.
In response to the 2021 freeze-off, in early June, the governor of Texas signed two bills. One of the bills decreased the number of board members in ERCOT, and required all board members to be residents of Texas. The other bill designated which entity will set requirements for winterization and set up a power outage alert system. In the second bill, the Public Utilities Commission (PUC) sets weather emergency reliability standards for some electric generating facilities. The bill also designated the Texas Railroad Commission to work with facility operators in the natural gas supply chain to implement measures and prepare for future weather emergencies. In addition, the governor of Texas sent a letter urging PUC to create incentives for developing and maintaining reliable sources of power within the ERCOT market.
Prior to the February 2021 event, the last major winter weather event in Texas was in 2011. It impacted a smaller area and had a shorter duration than the February 2021 event, with a decline in marketed natural gas production of 15.1%, or 89.0 Bcf. At the time, the event was the most prolonged cold spell Texas had seen in 25 years, with 100 hours at below freezing temperatures. For reference, depending on the area, the February 2021 event had 93 to 205 consecutive hours at or below freezing temperatures in Texas. In the aftermath of the freeze-off in 2011, the Federal Energy Regulatory Commission (FERC) released a report that offered recommendations for future winter storms, primarily winterizing operations. The Texas legislature's response to the 2011 storm was to pass a bill that required power plants to submit a weather emergency preparedness report.
Overview:
(For the week ending Wednesday, July 7, 2021)
- Natural gas spot prices fell at most locations this report week (Wednesday, June 30 to Wednesday, July 7). The Henry Hub spot price fell from $3.72 per million British thermal units (MMBtu) last Wednesday to $3.60/MMBtu yesterday.
- The price of the August 2021 NYMEX contract decreased 5¢, from $3.650/MMBtu last Wednesday to $3.596/MMBtu yesterday. The price of the 12-month strip averaging August 2021 through July 2022 futures contracts declined 1¢/MMBtu to $3.416/MMBtu.
- The net injections to working gas totaled 16 billion cubic feet (Bcf) for the week ending July 2. Working natural gas stocks totaled 2,574 Bcf, which is 18% lower than the year-ago level and 7% lower than the five-year (2016–2020) average for this week.
- The natural gas plant liquids composite price at Mont Belvieu, Texas, rose by 43¢/MMBtu, averaging $9.37/MMBtu for the week ending July 7. Although natural gas prices at the Houston Ship Channel rose by only 1%, ethane prices rose 5%, widening the ethane premium to natural gas on a heat-value parity by 20% compared with the previous week. Propane prices increased 7% following elevated propane exports from strong global demand. Propane inventories have recently been near the bottom of the previous five-year (2016–2020) range and below the five-year average since the end of 2020, which is also contributing to the upward pressure on prices. Normal butane and isobutane prices rose 3%, slightly less than the 4% increase in Brent crude oil. Natural gasoline prices were relatively flat compared with the previous week, increasing 1%.
- According to Baker Hughes, for the week ending Tuesday, June 29, the natural gas rig count increased by 1 to 99. The number of oil-directed rigs rose by 4 to 376. The total rig count increased by 5, and it now stands at 475.
Prices/Supply/Demand:
Gulf Coast prices decrease this week as a result of lower-than-normal temperatures. This report week (Wednesday, June 30 to Wednesday, July 7), the Henry Hub spot price fell 12¢ from $3.72/MMBtu last Wednesday to $3.60/MMBtu yesterday. The Agua Dulce price also decreased this week from $3.65/MMBtu to $3.50/MMBtu. Consumption of natural gas in the power sector decreased 3.9% this week in the Southeast, according to data from IHS Markit, as a result of temperatures in the region that were at or slightly lower than normal.
Prices in the western United States decline this week along with natural gas consumption in the electric power sector, and heat and drought conditions remain. The price at PG&E Citygate in Northern California fell 34¢, down from $5.05/MMBtu last Wednesday to $4.71/MMBtu yesterday. The price at SoCal Citygate in Southern California decreased 19¢ from $5.45/MMBtu last Wednesday to $5.26/MMBtu yesterday. Demand for natural gas in the electric power sector declined slightly this week in the western United States according to data from IHS Markit, although parts of the region remained under an excessive heat warning. The majority of the decrease in electric power consumption came from the Pacific Northwest where consumption declined almost 200 million cubic feet per day (MMcf/d). All of California and most of the Pacific Northwest remains under extreme or exceptional drought conditions that are affecting hydroelectric power generation.
Midwest prices decline as cooler weather moved in over the weekend. At the Chicago Citygate, the price decreased 15¢ from $3.56/MMBtu last Wednesday to $3.41/MMBtu yesterday. Natural gas consumed for electric power generation declined 6.9% this week compared with last week in the Midwest, according to data from IHS Markit, and average temperatures in Chicago were below normal on Friday and Saturday.
Prices in the Northeast declined sharply and then rose this week. At the Algonquin Citygate, which serves Boston-area consumers, the price went down $1.18 from $4.19/MMBtu last Wednesday to $3.01/MMBtu yesterday after reaching a low for the week of $2.76/MMBtu. At the Transcontinental Pipeline Zone 6 trading point for New York City, the price increased 7¢ from $3.19/MMBtu last Wednesday to $3.26/MMBtu yesterday, an increase from the 28¢ drop from last Wednesday, June 30 to Thursday, July 1.
Appalachia Basin price movements are mixed this week. The Tennessee Zone 4 Marcellus spot price increased 6¢ from $2.59/MMBtu last Wednesday to $2.65/MMBtu yesterday. The price at Eastern Gas South (formerly known as Dominion South until June 1, 2021) in Southwest Pennsylvania fell 8¢ from $2.81/MMBtu last Wednesday to $2.73/MMBtu yesterday after reaching a low of $2.66/MMBtu last Thursday.
The price at Eastern Gas South decreased sharply on Thursday, July 1 as a result of decreased flows on the Columbia Gas Transmission (TCO) pipeline caused by a MarkWest operational event (notice ID 25804810) at its Smithfield-Mobley and Sherwood locations in West Virginia. The event was estimated to have reduced production by 2 billion cubic feet per day (Bcf/d). MarkWest is a subsidiary of MPLX that gathers, processes, and transports natural gas. Over the holiday weekend, both the price at Eastern Gas South and natural gas flows on the TCO pipeline returned to normal levels once the issue was resolved (notice ID 25804640).
Prices in the Permian Basin also decline this week. The price at the Waha Hub in West Texas, which is located near Permian Basin production activities, averaged $3.53/MMBtu last Wednesday, 19¢/MMBtu lower than the Henry Hub price. Yesterday, the price at the Waha Hub averaged $3.44/MMBtu, 16¢/MMBtu lower than the Henry Hub price.
U.S. production of natural gas declines slightly this week. According to data from IHS Markit, the average total supply of natural gas fell by 0.5% compared with the previous report week. Dry natural gas production decreased by 0.6% compared with the previous report week to average 92.0 Bcf/d, and briefly reached a low of 90.0 Bcf/d over the weekend during the MarkWest operational event. Average net imports from Canada increased by 3.0% from last week to 5.0 Bcf/d.
Natural gas consumption by the electric power sector declines this week as record temperatures ease. Total U.S. consumption of natural gas fell by 3.8% compared with the previous report week, according to data from IHS Markit. All-time high temperatures in the West and higher-than-normal temperatures in the South eased this week, lessening natural gas consumption for power generation, which declined by 5.8% week over week. Consumption in the residential and commercial sectors also declined this week by 4.1%. Industrial sector consumption decreased by 0.1% week over week. Natural gas exports to Mexico decreased 2.9% and intermittent maintenance continued at the Agua Dulce and Brownsville Compressor stations. Natural gas deliveries to U.S. liquefied natural gas (LNG) export facilities (LNG pipeline receipts) averaged 10.9 Bcf/d, or 0.11 Bcf/d lower than last week.
U.S. LNG exports decrease week over week. Twenty LNG vessels (six from Sabine Pass; four each from Cameron, Corpus Christi, and Freeport; and two from Cove Point) with a combined LNG-carrying capacity of 75 Bcf departed the United States between July 1 and July 7, 2021, according to shipping data provided by Bloomberg Finance, L.P.
Sabine Pass LNG received authorization from the Federal Energy Regulatory Commission (FERC) to introduce fuel gas and commission the fuel gas system for Train 6, which is currently under construction. Sabine Pass LNG has five LNG liquefaction units (called trains) in operation and is the largest U.S. LNG export facility, with a combined capacity of 3.0 Bcf/d baseload (3.5 Bcf/d peak). The sixth train is the final train and will expand Sabine Pass’s LNG export capacity by an additional 0.7 Bcf/d (peak). Train 6 is expected to start LNG production by the end of this year and enter commercial service in the first quarter of 2022.
Storage:
The net injections into storage totaled 16 Bcf for the week ending July 2, compared with the five-year (2016–2020) average net injections of 63 Bcf and last year's net injections of 57 Bcf during the same week. Working natural gas stocks totaled 2,574 Bcf, which is 190 Bcf lower than the five-year average and 551 Bcf lower than last year at this time.
According to The Desk survey of natural gas analysts, estimates of the weekly net change to working natural gas stocks ranged from net injections of 16 Bcf to 58 Bcf, with a median estimate of 27 Bcf.
The average rate of injections into storage is 17% lower than the five-year average so far in the refill season (April through October). If the rate of injections into storage matched the five-year average of 7.9 Bcf/d for the remainder of the refill season, the total inventory would be 3,529 Bcf on October 31, which is 190 Bcf lower than the five-year average of 3,719 Bcf for that time of year.
More storage data and analysis can be found on the Natural Gas Storage Dashboard and the Weekly Natural Gas Storage Report.
See also:
 Source: U.S. Energy Information Administration, Natural Gas Monthly

| Spot Prices ($/MMBtu) | Thu, 1-Jul |
Fri, 2-Jul |
Mon, 5-Jul |
Tue, 6-Jul |
Wed, 7-Jul |
|---|---|---|---|---|---|
| Henry Hub | 3.75 | 3.62 | Holiday | 3.70 | 3.60 |
| New York | 2.91 | 3.10 | Holiday | 3.77 | 3.26 |
| Chicago | 3.46 | 3.43 | Holiday | 3.46 | 3.41 |
| Cal. Comp. Avg,* | 4.06 | 3.83 | Holiday | 4.09 | 4.25 |
| Futures ($/MMBtu) | |||||
| August Contract | 3.661 | 3.700 | Holiday | 3.637 | 3.596 |
| September Contract | 3.632 | 3.668 | Holiday | 3.608 | 3.574 |
*Avg. of NGI's reported prices for: Malin, PG&E Citygate, and Southern California Border Avg. Source: Graph by the U.S. Energy Information Administration (EIA), based on data from Natural Gas Intelligence Daily Gas Price Index |
|||||


| U.S. natural gas supply - Gas Week: (7/1/21 - 7/7/21) | |||
|---|---|---|---|
Average daily values (billion cubic feet) |
|||
this week |
last week |
last year |
|
| Marketed production | 103.8 |
104.6 |
101.9 |
| Dry production | 92.0 |
92.6 |
90.0 |
| Net Canada imports | 5.0 |
4.9 |
4.0 |
| LNG pipeline deliveries | 0.1 |
0.1 |
0.1 |
| Total supply | 97.1 |
97.6 |
94.1 |
|
Source: Chart by the U.S. Energy Information Administration (EIA), based on data from IHS Markit | |||
| U.S. natural gas consumption - Gas Week: (7/1/21 - 7/7/21) | |||
|---|---|---|---|
Average daily values (billion cubic feet) |
|||
this week |
last week |
last year |
|
| U.S. consumption | 64.3 |
66.9 |
70.2 |
| Power | 36.1 |
38.3 |
41.6 |
| Industrial | 20.2 |
20.2 |
20.5 |
| Residential/commercial | 8.1 |
8.4 |
8.0 |
| Mexico exports | 6.3 |
6.5 |
5.4 |
| Pipeline fuel use/losses | 6.2 |
6.3 |
6.4 |
| LNG pipeline receipts | 10.9 |
11.1 |
3.3 |
| Total demand | 87.8 |
90.8 |
85.3 |
|
Source: Chart by the U.S. Energy Information Administration (EIA), based on data from IHS Markit | |||


| Rigs | |||
|---|---|---|---|
Tue, June 29, 2021 |
Change from |
||
last week |
last year |
||
| Oil rigs | 376 |
1.1% |
103.2% |
| Natural gas rigs | 99 |
1.0% |
30.3% |
| Note: Excludes any miscellaneous rigs | |||
| Rig numbers by type | |||
|---|---|---|---|
Tue, June 29, 2021 |
Change from |
||
last week |
last year |
||
| Vertical | 16 |
-15.8% |
-5.9% |
| Horizontal | 429 |
1.9% |
89.8% |
| Directional | 30 |
0.0% |
50.0% |
| Source: Chart by the U.S. Energy Information Administration (EIA), based on data from Baker Hughes Company | |||
| Working gas in underground storage | ||||
|---|---|---|---|---|
Stocks billion cubic feet (Bcf) |
||||
| Region | 2021-07-02 |
2021-06-25 |
change |
|
| East | 521 |
513 |
8 |
|
| Midwest | 638 |
623 |
15 |
|
| Mountain | 177 |
173 |
4 |
|
| Pacific | 246 |
244 |
2 |
|
| South Central | 991 |
1,005 |
-14 |
|
| Total | 2,574 |
2,558 |
16 |
|
|
Source: U.S. Energy Information Administration Form EIA-912, Weekly Underground Natural Gas Storage Report | ||||
| Working gas in underground storage | |||||
|---|---|---|---|---|---|
Historical comparisons |
|||||
Year ago (7/2/20) |
5-year average (2016-2020) |
||||
| Region | Stocks (Bcf) |
% change |
Stocks (Bcf) |
% change |
|
| East | 654 |
-20.3 |
578 |
-9.9 |
|
| Midwest | 758 |
-15.8 |
656 |
-2.7 |
|
| Mountain | 179 |
-1.1 |
170 |
4.1 |
|
| Pacific | 309 |
-20.4 |
286 |
-14.0 |
|
| South Central | 1,225 |
-19.1 |
1,075 |
-7.8 |
|
| Total | 3,125 |
-17.6 |
2,764 |
-6.9 |
|
| Source: U.S. Energy Information Administration Form EIA-912, Weekly Underground Natural Gas Storage Report | |||||
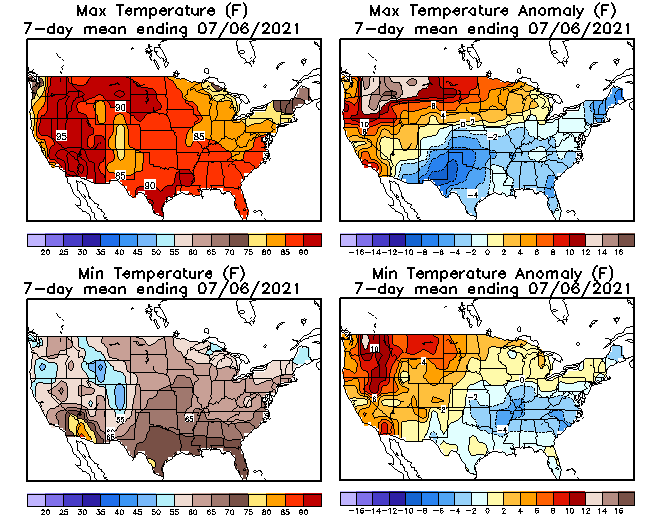
| Temperature – heating & cooling degree days (week ending Jul 01) | ||||||||
|---|---|---|---|---|---|---|---|---|
HDDs |
CDDs |
|||||||
| Region | Current total |
Deviation from normal |
Deviation from last year |
Current total |
Deviation from normal |
Deviation from last year |
||
| New England | 1 |
-2 |
0 |
75 |
48 |
34 |
||
| Middle Atlantic | 1 |
-1 |
0 |
84 |
43 |
25 |
||
| E N Central | 0 |
-2 |
-1 |
73 |
28 |
16 |
||
| W N Central | 1 |
-4 |
0 |
60 |
1 |
-12 |
||
| South Atlantic | 0 |
0 |
0 |
94 |
6 |
-8 |
||
| E S Central | 0 |
0 |
0 |
93 |
9 |
11 |
||
| W S Central | 0 |
0 |
0 |
112 |
-2 |
-4 |
||
| Mountain | 8 |
-4 |
1 |
71 |
3 |
5 |
||
| Pacific | 0 |
-8 |
-3 |
66 |
33 |
37 |
||
| United States | 1 |
-3 |
-1 |
82 |
19 |
12 |
||
|
Source: Chart by the U.S. Energy Information Administration (EIA), based on data from the National Oceanic and Atmospheric Administration Note: HDDs=heating degree days; CDDs=cooling degree days | ||||||||
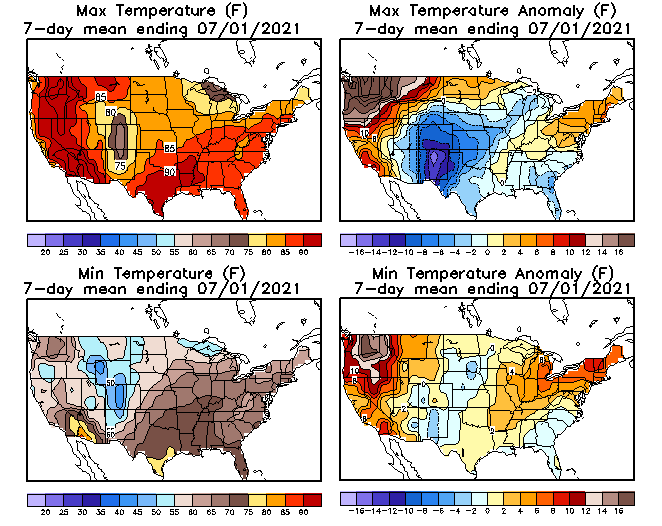
Average temperature (°F)
7-day mean ending Jul 01, 2021

Source: National Oceanic and Atmospheric Administration
Deviation between average and normal (°F)
7-day mean ending Jul 01, 2021
Source: National Oceanic and Atmospheric Administration
