In the News:
New pipeline capacity into New England increases deliverability of natural gas to constrained market
According to EIA’s Natural Gas Pipeline Project Tracker, three natural gas pipeline projects have been completed, partially completed, or have requested to enter service in 2020 that increase natural gas deliverability into New England. During days of peak demand in the winter, most of New England’s capacity is fully utilized, which can lead to spikes in spot natural gas prices and, in turn, wholesale electricity prices. These projects, which add 136 million cubic feet per day (MMcf/d) of capacity, will allow additional natural gas supplies to serve this constrained market.
Portland Xpress Phase 3, the final phase of an expansion project for the Portland Natural Gas Transmission System (PNGTS), was completed in October 2020, increasing deliverability on the PNGTS system by approximately 24 MMcf/d. New construction was added during Phase 3 as a result of three updates at existing facilities:
- Improvements to compressors in Westbrook, Maine
- Additional horsepower added to compressor in Eliot, Maine
- Upgrades to meters at meter stations in Dracut, Massachusetts
Tennessee Gas Pipeline Company’s (TGP) 261 Upgrade Project, consisting of two sub-projects totaling 72 MMcf/d, placed into service the Looping Project portion of the expansion. More than two miles of new 12-inch pipe was laid to replace sections of smaller, inactive pipes and to run new pipeline adjacent to existing pipeline. The Horsepower Replacement Project is planned to come online in November 2021, which will replace two turbine compressors with one newer, cleaner, and more efficient burning turbine compressor.
Enbridge’s Atlantic Bridge Project Phase 2, set to be completed in the last quarter of 2020, includes the construction and operation of a new compressor station in Weymouth, Massachusetts. The project is designed to increase capacity on the Algonquin Gas Transmission and Maritimes & Northeast Pipeline systems. The first phase came into service in November 2017, providing 40 MMcf/d of additional capacity on the Algonquin system. When the Weymouth compressor station underwent testing in September 2020 as part of Phase 2, mechanical failures required Enbridge to stop commissioning activities and repairs to the compressor station. Before the end of the month, a second incident occurred at the station, triggering additional investigations and repairs. Enbridge expects operations at the facility to resume in December.
For more information on the New England market, EIA's New England Dashboard reports on daily utilization by pipeline.
Overview:
(For the week ending Wednesday, December 2, 2020)
- Natural gas spot prices rose at most locations this report week (Wednesday, November 25 to Wednesday, December 2). The Henry Hub spot price rose from $2.28 per million British thermal units (MMBtu) last Wednesday to $2.70/MMBtu yesterday.
- At the New York Mercantile Exchange (Nymex), the December 2020 contract expired last Wednesday at $2.896/MMBtu. The January 2021 contract price decreased to $2.780/MMBtu, down 18¢/MMBtu from last Wednesday to yesterday. The price of the 12-month strip averaging January 2021 through December 2021 futures contracts declined 8¢/MMBtu to $2.773/MMBtu.
- The net withdrawals from working gas totaled 1 billion cubic feet (Bcf) for the week ending November 27. Working natural gas stocks totaled 3,939 Bcf, which is 10% more than the year-ago level and 8% more than the five-year (2015–19) average for this week.
- The natural gas plant liquids composite price at Mont Belvieu, Texas, rose by 21¢/MMBtu, averaging $5.44/MMBtu for the week ending December 2. The prices of propane, natural gasoline, butane, and isobutane rose by 8%, 4%, 4%, and 2%, respectively. The price of ethane fell by 1%.
- According to Baker Hughes, for the week ending Tuesday, November 24, the natural gas rig count increased by 1 to 77. The number of oil-directed rigs rose by 10 to 241. The total rig count increased by 10, and it now stands at 320.
Prices/Supply/Demand:
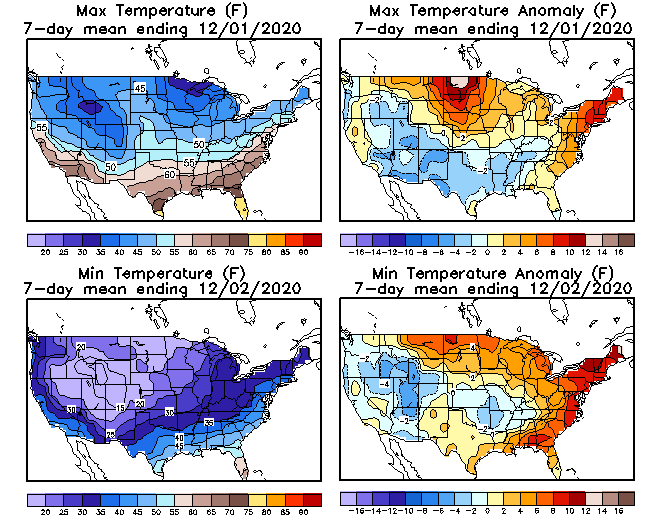
Prices rise at most locations in the Lower 48 states. This report week (Wednesday, November 25 to Wednesday, December 2), the Henry Hub spot price rose 42¢ from a low of $2.28/MMBtu last Wednesday to $2.70/MMBtu yesterday amid cooler temperatures compared with the prior week. Temperatures were generally close to normal across most of the country, but warmer than normal on the eastern seaboard and in the Midwest. At the Chicago Citygate, the price increased 16¢ from a low of $2.46/MMBtu last Wednesday to $2.62/MMBtu yesterday.
Prices increase in Southern California. The price at SoCal Citygate in Southern California increased $1.32 from a low of $3.51/MMBtu last Wednesday to a high of $4.83/MMBtu yesterday. S&P Platts reports that higher demand for natural gas in the Rockies because of cold weather has limited outflows to the Southwest, contributing to higher prices at SoCal Citygate. The price at PG&E Citygate in Northern California stayed level week over week at $3.71/MMBtu.
Northeast prices rise. At the Transcontinental Pipeline Zone 6 trading point for New York City, the price increased $1.02 from a low of $1.43/MMBtu last Wednesday to $2.45/MMBtu yesterday, with daytime temperatures averaging 60 degrees Fahrenheit. At the Algonquin Citygate, which serves Boston-area consumers, the price went up $1.03 from a low of $1.38/MMBtu last Wednesday to $2.41/MMBtu yesterday. The Algonquin Gas Transmission’s (AGT) declared a force majeure on Thursday at its compressor station in Weymouth, Massachusetts, 12 miles northwest of Boston. The compressor station entered service on October 1 as part of the Atlantic Bridge infrastructure expansion project, but the station has been having operational issues and temporarily shut down. The station recently received permission to restart from the Pipeline and Hazardous Materials Safety Administration (PHMSA) at reduced pressure.
The Tennessee Zone 4 Marcellus spot price increased 97¢ from $0.95/MMBtu last Wednesday to $1.92/MMBtu yesterday. The price at Dominion South in southwest Pennsylvania rose 83¢ from $1.11/MMBtu last Wednesday to $1.94/MMBtu yesterday.
Permian Basin discount to the Henry Hub narrows. The price at the Waha Hub in West Texas, which is located near Permian Basin production activities, averaged a low of $2.15/MMBtu last Wednesday, 13¢/MMBtu lower than the Henry Hub price. Yesterday, the price at the Waha Hub averaged $2.62/MMBtu, 8¢/MMBtu lower than the Henry Hub price.
Supply is flat. According to data from IHS Markit, the average total supply of natural gas remained the same as in the previous report week, averaging 95.8 Bcf/d. Dry natural gas production decreased by 0.6% compared with the previous report week. Average net imports from Canada increased by 14.0% from last week, offsetting the production decline.
Demand rises driven by heating demand in buildings. Total U.S. consumption of natural gas rose by 8.6% compared with the previous report week, according to data from IHS Markit. Natural gas consumed for power generation climbed by 5.9% week over week. In the residential and commercial sectors, consumption increased by 17.0% amid colder overnight temperatures. Industrial sector consumption increased by 1.9% week over week. Natural gas exports to Mexico increased 4.1%. Natural gas deliveries to U.S. liquefied natural gas (LNG) export facilities (LNG pipeline receipts) averaged 10.3 Bcf/d, or 0.6 Bcf/d higher than last week.
U.S. LNG exports are flat week over week. Eighteen LNG vessels (five from Sabine Pass, four from Freeport, three from Cameron, and two each from Cove Point, Corpus Christi, and Elba Island) with a combined LNG-carrying capacity of 65 Bcf departed the United States between November 26 and December 2, 2020, according to shipping data provided by Bloomberg Finance, L.P.
U.S. LNG exports set a new monthly record in November, averaging 9.4 Bcf/d, according to EIA’s estimates based on the shipping data provided by Bloomberg Finance, L.P. LNG exports in November were 17% higher than the previous monthly record set in January 2020 at 8.0 Bcf/d.
Storage:
The net withdrawals from storage totaled 1 Bcf for the week ending November 27, compared with the five-year (2015–19) average net withdrawals of 41 Bcf and last year's net withdrawals of 22 Bcf during the same week. Working natural gas stocks totaled 3,939 Bcf, which is 290 Bcf more than the five-year average and 343 Bcf more than last year at this time.
According to The Desk survey of natural gas analysts, estimates of the weekly net change to working natural gas stocks ranged from net withdrawals of 26 Bcf to net injections of 7 Bcf, with a median estimate of net withdrawals of 10 Bcf.
More storage data and analysis can be found on the Natural Gas Storage Dashboard and the Weekly Natural Gas Storage Report.
See also:


| Spot Prices ($/MMBtu) | Thu, 26-Nov |
Fri, 27-Nov |
Mon, 30-Nov |
Tue, 1-Dec |
Wed, 2-Dec |
|---|---|---|---|---|---|
| Henry Hub | Holiday | Closed | 2.88 | 2.81 | 2.70 |
| New York | Holiday | Closed | 2.59 | 2.63 | 2.45 |
| Chicago | Holiday | Closed | 2.68 | 2.55 | 2.62 |
| Cal. Comp. Avg,* | Holiday | Closed | 3.94 | 3.85 | 3.93 |
| Futures ($/MMBtu) | |||||
| January Contract | Holiday | 2.843 | 2.882 | 2.880 | 2.780 |
| February Contract | Holiday | 2.832 | 2.865 | 2.868 | 2.778 |
| *Avg. of NGI's reported prices for: Malin, PG&E Citygate, and Southern California Border Avg. | |||||
| Source: NGI's Daily Gas Price Index | |||||
| Spot Prices ($/MMBtu) | Thu, 19-Nov |
Fri, 20-Nov |
Mon, 23-Nov |
Tue, 24-Nov |
Wed, 25-Nov |
|---|---|---|---|---|---|
| Henry Hub | 2.20 | 2.22 | 2.22 | 2.29 | 2.28 |
| New York | 1.49 | 1.74 | 2.20 | 1.71 | 1.43 |
| Chicago | 2.11 | 2.16 | 2.24 | 2.25 | 2.46 |
| Cal. Comp. Avg,* | 3.50 | 3.35 | 3.62 | 3.61 | 3.40 |
| Futures ($/MMBtu) | |||||
| December Contract | 2.592 | 2.650 | 2.711 | 2.775 | 2.896 |
| January Contract | 2.720 | 2.770 | 2.823 | 2.900 | 2.961 |
| *Avg. of NGI's reported prices for: Malin, PG&E Citygate, and Southern California Border Avg. | |||||
| Source: NGI's Daily Gas Price Index | |||||


| U.S. natural gas supply - Gas Week: (11/26/20 - 12/2/20) | |||
|---|---|---|---|
Average daily values (Bcf/d): |
|||
this week |
last week |
last year |
|
| Marketed production | 102.1 |
102.7 |
109.1 |
| Dry production | 90.9 |
91.4 |
97.1 |
| Net Canada imports | 4.8 |
4.2 |
3.5 |
| LNG pipeline deliveries | 0.1 |
0.1 |
0.1 |
| Total supply | 95.8 |
95.7 |
100.7 |
|
Source: IHS Markit | |||
| U.S. natural gas consumption - Gas Week: (11/26/20 - 12/2/20) | |||
|---|---|---|---|
Average daily values (Bcf/d): |
|||
this week |
last week |
last year |
|
| U.S. consumption | 80.1 |
73.7 |
85.7 |
| Power | 25.7 |
24.3 |
26.0 |
| Industrial | 23.8 |
23.3 |
24.5 |
| Residential/commercial | 30.5 |
26.1 |
35.2 |
| Mexico exports | 5.6 |
5.4 |
5.2 |
| Pipeline fuel use/losses | 7.2 |
7.1 |
7.8 |
| LNG pipeline receipts | 10.3 |
9.7 |
7.5 |
| Total demand | 103.2 |
95.9 |
106.2 |
|
Source: IHS Markit | |||


| Rigs | |||
|---|---|---|---|
Tue, November 24, 2020 |
Change from |
||
last week |
last year |
||
| Oil rigs | 241 |
4.3% |
-63.9% |
| Natural gas rigs | 77 |
1.3% |
-41.2% |
| Note: Excludes any miscellaneous rigs | |||
| Rig numbers by type | |||
|---|---|---|---|
Tue, November 24, 2020 |
Change from |
||
last week |
last year |
||
| Vertical | 15 |
-16.7% |
-68.8% |
| Horizontal | 283 |
4.0% |
-59.6% |
| Directional | 22 |
10.0% |
-58.5% |
| Source: Baker Hughes Co. | |||
| Working gas in underground storage | ||||
|---|---|---|---|---|
Stocks billion cubic feet (Bcf) |
||||
| Region | 2020-11-27 |
2020-11-20 |
change |
|
| East | 934 |
934 |
0 |
|
| Midwest | 1,122 |
1,133 |
-11 |
|
| Mountain | 240 |
242 |
-2 |
|
| Pacific | 318 |
320 |
-2 |
|
| South Central | 1,326 |
1,312 |
14 |
|
| Total | 3,939 |
3,940 |
-1 |
|
|
Source: Form EIA-912, Weekly Underground Natural Gas Storage Report | ||||
| Working gas in underground storage | |||||
|---|---|---|---|---|---|
Historical comparisons |
|||||
Year ago (11/27/19) |
5-year average (2015-2019) |
||||
| Region | Stocks (Bcf) |
% change |
Stocks (Bcf) |
% change |
|
| East | 892 |
4.7 |
871 |
7.2 |
|
| Midwest | 1,043 |
7.6 |
1,053 |
6.6 |
|
| Mountain | 201 |
19.4 |
212 |
13.2 |
|
| Pacific | 288 |
10.4 |
311 |
2.3 |
|
| South Central | 1,172 |
13.1 |
1,202 |
10.3 |
|
| Total | 3,596 |
9.5 |
3,649 |
7.9 |
|
| Source: Form EIA-912, Weekly Underground Natural Gas Storage Report | |||||
| Temperature – heating & cooling degree days (week ending Nov 26) | ||||||||
|---|---|---|---|---|---|---|---|---|
HDD deviation from: |
CDD deviation from: |
|||||||
| Region | HDD Current |
normal |
last year |
CDD Current |
normal |
last year |
||
| New England | 151 |
-30 |
-17 |
0 |
0 |
0 |
||
| Middle Atlantic | 128 |
-44 |
-31 |
0 |
0 |
0 |
||
| E N Central | 158 |
-40 |
-14 |
0 |
0 |
0 |
||
| W N Central | 186 |
-36 |
-8 |
0 |
0 |
0 |
||
| South Atlantic | 82 |
-36 |
-29 |
15 |
4 |
7 |
||
| E S Central | 82 |
-40 |
-16 |
0 |
-1 |
0 |
||
| W S Central | 43 |
-43 |
-17 |
16 |
12 |
7 |
||
| Mountain | 172 |
-21 |
-29 |
3 |
3 |
3 |
||
| Pacific | 96 |
-3 |
-10 |
0 |
-1 |
0 |
||
| United States | 123 |
-32 |
-18 |
5 |
2 |
2 |
||
|
Note: HDD = heating degree day; CDD = cooling degree day Source: National Oceanic and Atmospheric Administration | ||||||||
Average temperature (°F)
7-day mean ending Nov 26, 2020

Source: National Oceanic and Atmospheric Administration
Deviation between average and normal (°F)
7-day mean ending Nov 26, 2020
Source: National Oceanic and Atmospheric Administration
