In the News:
U.S. net natural gas exports begin to decline in spring 2020
In 2017, the United States became a net natural gas exporter (exported more than it imported) on an annual basis for the first time in nearly 60 years. Since then, the United States has more than doubled its net natural gas exports every year: from 0.3 billion cubic feet per day (Bcf/d) in 2017 to 2.0 Bcf/d in 2018 and 5.2 Bcf/d in 2019. Although growth in net natural gas exports continued in the first six months of 2020, compared to the same period in 2019, net exports began declining in spring 2020 with a global economic slowdown and COVID-19 containment efforts. Starting in April, U.S. gross LNG exports, gross pipeline exports to Canada and Mexico, and gross pipeline imports from Canada started to decline, according to the U.S. Energy Information Administration’s (EIA)’s recently released Natural Gas Monthly, which includes data through June 2020.
The United States is a net exporter of LNG and natural gas by pipeline to Mexico and is a net importer of natural gas by pipeline from Canada. In the first half of 2020, net exports averaged 7.3 Bcf/d or nearly 80% (3.2 Bcf/d) higher than during the same period last year. From January 2020 through June 2020, net LNG exports increased by almost 60% (2.4 Bcf/d), net pipeline exports to Mexico increased by 4% (0.2 Bcf/d), and net imports by pipeline from Canada declined by 12% (0.6 Bcf/d) compared to the first six months of 2019.
LNG trade. U.S. LNG exports continued strong growth in the first three months of 2020, averaging 7.9 Bcf/d, which was 3.9 Bcf/d (98%) higher compared to the same period last year. LNG exports started to decline in April amid a global reduction in natural gas consumption and a decline in global natural gas and LNG prices. In June 2020, U.S. LNG exports averaged 3.6 Bcf/d, or less than half of January’s export levels, and continued to decline in July to 3.1 Bcf/d.
U.S. LNG imports in the first half of 2020 were similar to import levels in the first half of 2019, averaging 0.2 Bcf/d. About one-half (56%) of LNG imported in the first six months of 2020 went to the Everett LNG terminal offshore Boston, Massachusetts, primarily to meet New England’s winter demand. Several LNG cargoes were also imported to Cove Point terminal in Maryland and to Elba Island terminal in Georgia.
Trade by pipeline with Mexico. U.S. natural gas exports by pipeline to Mexico averaged 5.1 Bcf/d in 2019 following an expansion of cross-border pipeline capacity from the United States to Mexico. In the first half of 2020, U.S. pipeline exports to Mexico averaged 5.1 Bcf/d, a 4% increase (0.2 Bcf/d) compared to the same period last year. In June 2020, a part of the Wahalajara pipeline system, which connects natural gas supply from the U.S. Permian Basin at the Waha Hub to Mexico’s central and western regions, was placed in service. Since then, U.S. pipeline exports to Mexico have increased to 5.4 Bcf/d, mainly displacing LNG imports from the United States and other countries. EIA projects that U.S. pipeline exports to Mexico will continue to grow in the coming months.
Trade by pipeline with Canada. U.S. gross natural gas pipeline exports to Canada averaged 2.6 Bcf/d, remaining essentially unchanged in the first six months of 2020 compared to the same period last year and the 2019 annual average.
However, U.S. natural gas pipeline imports from Canada have declined by 0.7 Bcf/d (9%) in the first half of 2020 compared to the same period last year. The decline was mainly because of
- Higher natural gas demand in Canada
- Low storage inventories at the end of Canada’s winter season
- Higher natural gas spot prices at the NOVA/AECO-C (AECO) trading hub in Alberta, Canada compared to Henry Hub spot prices in the United States
According to EIA’s Short-Term Energy Outlook, net natural gas exports are forecast to continue increasing, primarily because of expected increase in the U.S. LNG exports returning to pre-COVID levels by November 2020 and averaging above 9 Bcf/d in the winter 2020–21.
Overview:
(For the week ending Wednesday, September 9, 2020)
- Natural gas spot prices fell at most locations this report week (Wednesday, September 2 to Wednesday, September 9). The Henry Hub spot price remained flat at $2.19 per million British thermal units (MMBtu).
- At the New York Mercantile Exchange (Nymex), the price of the October 2020 contract decreased 8¢, from $2.486/MMBtu last Wednesday to $2.406/MMBtu yesterday. The price of the 12-month strip averaging October 2020 through September 2021 futures contracts declined 1¢/MMBtu to $2.964/MMBtu.
- The net injections to working gas totaled 70 billion cubic feet (Bcf) for the week ending September 4. Working natural gas stocks totaled 3,525 Bcf, which is 18% more than the year-ago level and 13% more than the five-year (2015–19) average for this week.
- The natural gas plant liquids composite price at Mont Belvieu, Texas, fell by 37¢/MMBtu, averaging $4.70/MMBtu for the week ending September 9. The prices of butane, natural gasoline, isobutane, propane, and ethane all fell by 2%, 3%, 5%, 7%, and 13%, respectively.
- According to Baker Hughes, for the week ending Tuesday, September 1, the natural gas rig count remained flat at 72. The number of oil-directed rigs rose by 1 to 181. The total rig count increased by 2, and it now stands at 256.
Prices/Supply/Demand:
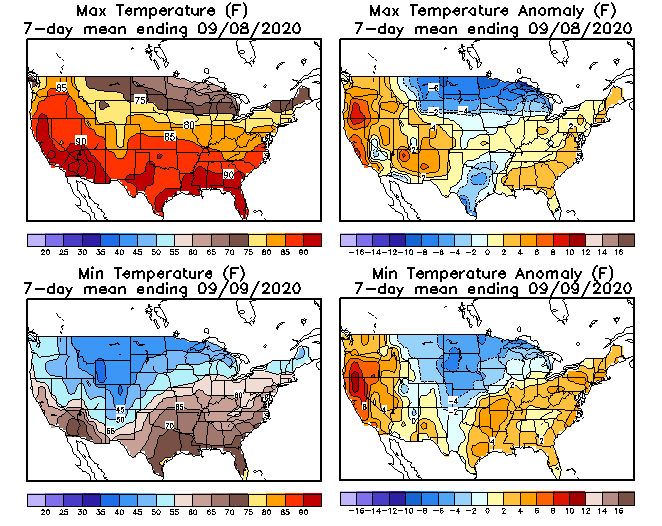
Prices fall at most locations. This report week (Wednesday, September 2 to Wednesday, September 9), the Henry Hub spot price remained flat at $2.19/MMBtu. Temperatures were much warmer than normal in western states and cooler than normal across the Midwest. At the Chicago Citygate, the price decreased 22¢ from $2.17/MMBtu last Wednesday to a low of $1.95/MMBtu yesterday.
Wildfires continue to blaze in the West. Firefighters across the western states are battling several large wildfires. According to the National Interagency Fire Center, 96 large fires have burned more than 3.4 million acres of land as of yesterday. On Tuesday, Pacific Gas and Electricity (PG&E) shut off power to approximately 172,000 customers in 22 counties in Northern California because of high winds and fire risk, lowering natural gas consumption. As of last night, approximately 97% of power had been restored.
California prices are down following weekend heatwave. Temperatures averaged higher than 85 degrees Fahrenheit across most of the state. The price at PG&E Citygate in Northern California fell 4¢, down from $3.59/MMBtu last Wednesday to a low of $3.55/MMBtu yesterday. The price at SoCal Citygate in Southern California decreased 3¢ from $3.15/MMBtu last Wednesday to a low of $3.12/MMBtu yesterday after reaching a high of $8.05/MMBtu on Friday ahead of a heatwave that affected California over the Labor Day weekend. Temperatures in Los Angeles reached up to 111 degrees Fahrenheit on Sunday.
Northeast prices are mixed. At the Algonquin Citygate, which serves Boston-area consumers, the price went up 76¢ from a low of $1.70/MMBtu last Wednesday to a high of $2.46/MMBtu yesterday. At the Transcontinental Pipeline Zone 6 trading point for New York City, the price decreased 10¢ from a high of $1.76/MMBtu last Wednesday to $1.66/MMBtu yesterday.
The Tennessee Zone 4 Marcellus spot price decreased 23¢ from $1.39/MMBtu last Wednesday to $1.16/MMBtu yesterday. The price at Dominion South in southwest Pennsylvania fell 2¢ from $1.53/MMBtu last Wednesday to $1.51/MMBtu yesterday.
Permian Basin discount to the Henry Hub widens. The price at the Waha Hub in West Texas, which is located near Permian Basin production activities, averaged $1.91/MMBtu last Wednesday, 28¢/MMBtu lower than the Henry Hub price. Yesterday, the price at the Waha Hub averaged $1.24/MMBtu, 95¢/MMBtu lower than the Henry Hub price. Yesterday the El Paso Natural Gas pipeline system lifted the force majeure that was issued on September 1, which had been limiting takeaway capacity out of the region.
Supply falls slightly. According to data from IHS Markit, the average total supply of natural gas fell by 0.3% compared with the previous report week. Dry natural gas production grew by 0.7% compared with the previous report week as Gulf of Mexico production returned following Hurricane Laura-related shut-ins. Average net imports from Canada decreased by 19.4% from last week.
Demand falls, driven by declines in power generation. Total U.S. consumption of natural gas fell by 3.9% compared with the previous report week, according to data from IHS Markit. Natural gas consumed for power generation declined by 7.8% week over week. In the residential and commercial sectors, consumption declined by 0.1%. Industrial sector consumption increased by 1.8% week over week. Natural gas exports to Mexico decreased 1.8%. Natural gas deliveries to U.S. liquefied natural gas (LNG) export facilities (LNG pipeline receipts) averaged 4.6 Bcf/d, or 1.8 Bcf/d higher than last week. LNG pipeline receipts reached a high of 6.7 Bcf/d on Wednesday, the highest level for LNG pipeline receipts since early May and nearly 0.9 Bcf/d more than the same time last year.
U.S. LNG exports are flat week over week. Six LNG vessels (three from Corpus Christi, two from Freeport, and one from Cove Point) with a combined LNG-carrying capacity of 21 Bcf departed the United States between September 3 and September 9, according to shipping data provided by Marine Traffic.
Sabine Pass LNG terminal has resumed operations after Hurricane Laura. Feedgas deliveries at the terminal averaged 2.8 Bcf/d yesterday, implying 93% baseload capacity utilization, according to data by S&P Global Platts. Cameron LNG terminal, which was also in the direct path of Hurricane Laura, remains shut down and has not received any feedgas deliveries since August 25.
Storage:
The net injections into storage totaled 70 Bcf for the week ending September 4, compared with the five-year (2015–19) average net injections of 68 Bcf and last year's net injections of 80 Bcf during the same week. Working natural gas stocks totaled 3,525 Bcf, which is 409 Bcf more than the five-year average and 528 Bcf more than last year at this time.
According to The Desk survey of natural gas analysts, estimates of the weekly net change to working natural gas stocks ranged from net injections of 59 Bcf to 83 Bcf, with a median estimate of 69 Bcf.
The average rate of injections into storage is 7% higher than the five-year average so far in the refill season (April through October). If the rate of injections into storage matched the five-year average of 10.6 Bcf/d for the remainder of the refill season, the total inventory would be 4,132 Bcf on October 31, which is 409 Bcf higher than the five-year average of 3,723 Bcf for that time of year.
More storage data and analysis can be found on the Natural Gas Storage Dashboard and the Weekly Natural Gas Storage Report.
See also:


| Spot Prices ($/MMBtu) | Thu, 3-Sep |
Fri, 4-Sep |
Mon, 7-Sep |
Tue, 8-Sep |
Wed, 9-Sep |
|---|---|---|---|---|---|
| Henry Hub | 2.32 | 1.91 | Holiday | 2.33 | 2.19 |
| New York | 1.58 | 1.36 | Holiday | 1.74 | 1.66 |
| Chicago | 2.20 | 1.97 | Holiday | 2.02 | 1.95 |
| Cal. Comp. Avg.* | 3.72 | 4.72 | Holiday | 2.94 | 2.88 |
| Futures ($/MMBtu) | |||||
| October Contract | 2.487 | 2.588 | Holiday | 2.400 | 2.406 |
| November Contract | 2.927 | 2.987 | Holiday | 2.892 | 2.873 |
| *Avg. of NGI's reported prices for: Malin, PG&E Citygate, and Southern California Border Avg. | |||||
| Source: NGI's Daily Gas Price Index | |||||


| U.S. natural gas supply - Gas Week: (9/3/20 - 9/9/20) | |||
|---|---|---|---|
Average daily values (Bcf/d): |
|||
this week |
last week |
last year |
|
| Marketed production | 100.7 |
100.0 |
105.5 |
| Dry production | 89.1 |
88.5 |
93.7 |
| Net Canada imports | 3.6 |
4.5 |
4.6 |
| LNG pipeline deliveries | 0.1 |
0.1 |
0.1 |
| Total supply | 92.8 |
93.1 |
98.3 |
|
Source: IHS Markit | |||
| U.S. natural gas consumption - Gas Week: (9/3/20 - 9/9/20) | |||
|---|---|---|---|
Average daily values (Bcf/d): |
|||
this week |
last week |
last year |
|
| U.S. consumption | 63.8 |
66.4 |
68.8 |
| Power | 35.0 |
38.0 |
38.5 |
| Industrial | 20.7 |
20.3 |
21.8 |
| Residential/commercial | 8.1 |
8.1 |
8.5 |
| Mexico exports | 6.0 |
6.1 |
5.2 |
| Pipeline fuel use/losses | 6.6 |
6.7 |
7.1 |
| LNG pipeline receipts | 4.6 |
2.8 |
5.7 |
| Total demand | 81.1 |
82.0 |
86.9 |
|
Source: IHS Markit | |||


| Rigs | |||
|---|---|---|---|
Tue, September 01, 2020 |
Change from |
||
last week |
last year |
||
| Oil rigs | 181 |
0.6% |
-75.5% |
| Natural gas rigs | 72 |
0.0% |
-55.0% |
| Note: Excludes any miscellaneous rigs | |||
| Rig numbers by type | |||
|---|---|---|---|
Tue, September 01, 2020 |
Change from |
||
last week |
last year |
||
| Vertical | 16 |
23.1% |
-66.7% |
| Horizontal | 220 |
-0.5% |
-71.9% |
| Directional | 20 |
0.0% |
-70.1% |
| Source: Baker Hughes Co. | |||
| Working gas in underground storage | ||||
|---|---|---|---|---|
Stocks billion cubic feet (Bcf) |
||||
| Region | 2020-09-04 |
2020-08-28 |
change |
|
| East | 805 |
789 |
16 |
|
| Midwest | 953 |
924 |
29 |
|
| Mountain | 216 |
212 |
4 |
|
| Pacific | 308 |
304 |
4 |
|
| South Central | 1,243 |
1,225 |
18 |
|
| Total | 3,525 |
3,455 |
70 |
|
|
Source: Form EIA-912, Weekly Underground Natural Gas Storage Report | ||||
| Working gas in underground storage | |||||
|---|---|---|---|---|---|
Historical comparisons |
|||||
Year ago (9/4/19) |
5-year average (2015-2019) |
||||
| Region | Stocks (Bcf) |
% change |
Stocks (Bcf) |
% change |
|
| East | 732 |
10.0 |
756 |
6.5 |
|
| Midwest | 853 |
11.7 |
849 |
12.2 |
|
| Mountain | 181 |
19.3 |
194 |
11.3 |
|
| Pacific | 275 |
12.0 |
297 |
3.7 |
|
| South Central | 955 |
30.2 |
1,021 |
21.7 |
|
| Total | 2,997 |
17.6 |
3,116 |
13.1 |
|
| Source: Form EIA-912, Weekly Underground Natural Gas Storage Report | |||||
| Temperature – heating & cooling degree days (week ending Sep 03) | ||||||||
|---|---|---|---|---|---|---|---|---|
HDD deviation from: |
CDD deviation from: |
|||||||
| Region | HDD Current |
normal |
last year |
CDD Current |
normal |
last year |
||
| New England | 7 |
-2 |
1 |
19 |
1 |
2 |
||
| Middle Atlantic | 2 |
-4 |
0 |
46 |
17 |
13 |
||
| E N Central | 5 |
-5 |
-5 |
45 |
16 |
23 |
||
| W N Central | 9 |
-6 |
-4 |
43 |
3 |
7 |
||
| South Atlantic | 0 |
-1 |
0 |
106 |
28 |
17 |
||
| E S Central | 0 |
-1 |
0 |
101 |
30 |
24 |
||
| W S Central | 0 |
-1 |
0 |
133 |
27 |
11 |
||
| Mountain | 8 |
-10 |
7 |
64 |
7 |
-25 |
||
| Pacific | 2 |
-5 |
2 |
48 |
9 |
-24 |
||
| United States | 3 |
-4 |
-1 |
70 |
17 |
7 |
||
|
Note: HDD = heating degree day; CDD = cooling degree day Source: National Oceanic and Atmospheric Administration | ||||||||
Average temperature (°F)
7-day mean ending Sep 03, 2020

Source: National Oceanic and Atmospheric Administration
Deviation between average and normal (°F)
7-day mean ending Sep 03, 2020
Source: National Oceanic and Atmospheric Administration
