In the News:
Natural gas price differentials to Henry Hub narrowed at most hubs in the first half of 2020
The average spot price differentials between regional natural gas hubs and the Henry Hub, also typically known in the natural gas industry as the basis price, have narrowed at many trading hubs in the first half of 2020 compared with the first half of 2019. Natural gas basis reflects the difference between the price of natural gas at the benchmark Henry Hub in Louisiana and the price of natural gas at another delivery point elsewhere in the country. The basis at key demand hubs (near population centers) narrowed primarily because of weather-related factors, and the basis at some supply hubs (near production areas) narrowed because of decreases in natural gas production. Declines in economic activity related to coronavirus disease (COVID-19) and its mitigation efforts generally helped to further narrow the basis at both demand and supply hubs.
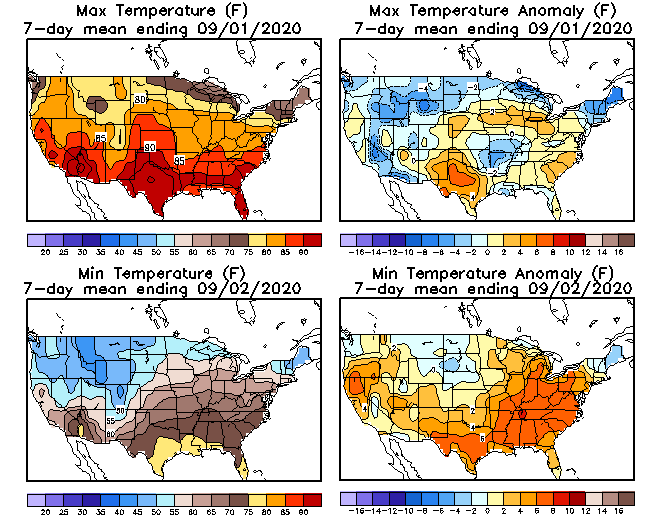
Warmer-than-normal temperatures during the 2019–2020 heating season (November 1–March 31) contributed to lower basis prices early in 2020 at key natural gas hubs serving demand markets, such as SoCal Citygate in Southern California; Algonquin Citygate near Boston, Massachusetts; and Transco Zone 5 in Virginia. At Algonquin Citygate, mild winter temperatures in New England contributed to a lower premium to Henry Hub in 2020 compared with past years, with the basis turning negative by March instead of by April or May, which is a more typical basis price seasonal pattern at Algonquin Citygate. Some demand hubs, especially SoCal Citygate and Algonquin Citygate, are often constrained by pipeline infrastructure, which limits the flow of natural gas into the region and leads to wider basis prices.
In Southern California, improvements to natural gas infrastructure—pipeline repair completions and additional flexibility withdrawing natural gas from the Aliso Canyon facility—narrowed the basis price at the SoCal Citygate in early 2020 after peaking at nearly $8 per million British thermal units (MMBtu) in February 2019 as a result of cold weather and pipeline constraints.
Basis prices remained narrow in Southern California between January and July 2020, despite constrained pipeline infrastructure that generally increases basis prices. However, in mid-August 2020, the basis price at SoCal Citygate briefly reached $11.00/MMBtu amid increasing demand for natural gas-fired power generation, driven by intense summer heat. The increase in power demand resulted in California Independent System Operator (CAISO) issuing rotating power outages.
Demand for natural gas at U.S. commercial and industrial establishments declined from March through June 2020 because of reduced economic activity related to COVID-19, which also contributed to relatively narrow basis prices.
Natural gas hubs located in producing areas, such as the Waha Hub in West Texas and the Dominion South Hub in southwestern Pennsylvania, typically trade at a discount to Henry Hub. This discount widens when pipeline constraints limit natural gas takeaway capacity out of the region. Crude oil and associated natural gas production declined in the first half of 2020, exacerbated by the economic impact of COVID-19 and declining crude oil prices in the spring of 2020.
Throughout 2019, the basis price at the Waha Hub, located in the Permian Basin, was wide. Waha prices fell nearly $3.00/MMBtu less than Henry Hub prices in April 2019. In the first half of 2020, the basis narrowed as a result of low crude oil prices and reduced associated natural gas production in the Permian Basin. EIA estimates natural gas production in the Permian Basin has declined about 10% since January’s high of 10.3 billion cubic feet per day (Bcf/d). Additional pipeline takeaway capacity completed during the past year also helped support higher prices at Waha, narrowing the basis price.
At Dominion South, located in the Appalachian Basin, the basis price stayed relatively similar in the first half of 2020 compared with the first half of 2019. Compared with the Permian Basin, the Appalachian Basin has less oil-directed drilling. Lower oil prices have not affected shale natural gas production in the Appalachian Basin, where production has declined by less than 1% since the beginning of 2020.
Overview:
(For the week ending Wednesday, September 2, 2020)
- Natural gas spot price movements were mixed this report week (Wednesday, August 26 to Wednesday, September 2). The Henry Hub spot price fell from $2.51 per million British thermal units (MMBtu) last Wednesday to $2.19/MMBtu yesterday.
- At the New York Mercantile Exchange (Nymex), the September 2020 contract expired Thursday at $2.579/MMBtu, up 12¢/MMBtu from last Wednesday. The October 2020 contract price decreased to $2.486/MMBtu, down 9¢/MMBtu from last Wednesday to yesterday. The price of the 12-month strip averaging October 2020 through September 2021 futures contracts climbed 10¢/MMBtu to $2.973/MMBtu.
- The net injections to working gas totaled 35 billion cubic feet (Bcf) for the week ending August 28. Working natural gas stocks totaled 3,455 Bcf, which is 18% more than the year-ago level and 13% more than the five-year (2015–19) average for this week.
- The natural gas plant liquids composite price at Mont Belvieu, Texas, fell by 8¢/MMBtu, averaging $5.11/MMBtu for the week ending September 2. The price of ethane fell by 9%. The prices of propane, butane, and isobutane rose by 1%, 3%, and 4%, respectively. The price of natural gasoline remained flat week over week.
- According to Baker Hughes, for the week ending Tuesday, August 25, the natural gas rig count increased by 3 to 72. The number of oil-directed rigs fell by 3 to 180. The total rig count stayed at 254.
Prices/Supply/Demand:
Prices are mixed following Hurricane Laura. This report week (Wednesday, August 26 to Wednesday, September 2), the Henry Hub spot price fell 32¢ from $2.51/MMBtu last Wednesday to a low of $2.19/MMBtu yesterday. Temperatures were warmer than normal in the Southeast and cooler than normal across in the Midwest. At the Chicago Citygate, the price decreased 16¢ from $2.33/MMBtu last Wednesday to $2.17/MMBtu yesterday.
Natural gas demand is down on the Gulf Coast following Hurricane Laura. At the end of the last report week, Hurricane Laura struck the Louisiana-Texas border, home to key energy infrastructure, especially liquefied natural gas (LNG) terminals and natural gas processing plants. Natural gas deliveries to these facilities are down this report week, and it may take weeks to recover to pre-Hurricane levels.
Some of the refineries, industrial plants, and LNG export facilities in the region are still without power. Genscape reports that Motiva Enterprises LLC crude oil refinery and the Natgasoline methanol plant have returned to 50% and 70% of production levels, respectively.
The Bureau of Safety and Environmental Enforcement (BSEE) reports that as of yesterday, approximately 20% of the current natural gas production and 20% of oil production in the Gulf of Mexico remains shut-in.
California prices are mixed with seasonal temperatures. The price at PG&E Citygate in Northern California rose 9¢, up from $3.50/MMBtu last Wednesday to $3.59/MMBtu yesterday with temperatures that were slightly warmer than normal as Northern California continues to battle wildfires. The price at SoCal Citygate in Southern California decreased $1.46 from $4.61/MMBtu last Wednesday to $3.15/MMBtu yesterday as the region posted net injections natural gas into underground storage every day this week amid cooler temperatures.
Northeast prices are mixed amid cooler-than-normal temperatures. At the Algonquin Citygate, which serves Boston-area consumers, the price went up 18¢ from $1.52/MMBtu last Wednesday to $1.70/MMBtu yesterday. At the Transcontinental Pipeline Zone 6 trading point for New York City, the price decreased 22¢ from $1.98/MMBtu last Wednesday to $1.76/MMBtu yesterday.
The Tennessee Zone 4 Marcellus spot price increased 17¢ from $1.22/MMBtu last Wednesday to $1.39/MMBtu yesterday. The price at Dominion South in southwest Pennsylvania rose 17¢ from $1.36/MMBtu last Wednesday to $1.53/MMBtu yesterday.
Permian Basin basis to the Henry Hub narrows. The price at the Waha Hub in West Texas, which is located near Permian Basin production activities, averaged $1.07/MMBtu last Wednesday, $1.44/MMBtu lower than the Henry Hub price. Yesterday, the price at the Waha Hub averaged a weekly high of $1.91/MMBtu, 28¢/MMBtu lower than the Henry Hub price, as El Paso Natural Gas (EPNG) announced that it resolved the Cornudas Station Unit 1B issue, which caused EPNG to declare a force majeure on April 2.
Supply falls slightly. According to data from IHS Markit, the average total supply of natural gas fell by 0.8% compared with the previous report week. Dry natural gas production remained unchanged week over week, despite ongoing shut-ins in the Gulf of Mexico production. Average net imports from Canada decreased by 14.1% from last week with cooler temperatures at border crossing points in the Northeast, Midwest, and Pacific Northwest.
Demand drops driven by declines in power generation and building use. Total U.S. consumption of natural gas fell by 5.4% compared with the previous report week, according to data from IHS Markit. Natural gas consumed for power generation declined by 7.8% week over week. In the residential and commercial sectors, consumption declined by 5.4%. Industrial sector consumption decreased by 0.5% week over week. Natural gas exports to Mexico decreased 1.4%. Natural gas deliveries to U.S. LNG export facilities (LNG pipeline receipts) averaged 2.8 Bcf/d, which is down by half, or 1.4 Bcf/d lower following Hurricane Laura.
U.S. LNG exports decrease week over week. Six liquefied LNG vessels (three from Corpus Christi, two from Cove Point, and one from Elba Island) with a combined LNG-carrying capacity of 21 Bcf departed the United States between August 27 and September 2, 2020, according to shipping data provided by Marine Traffic.
LNG pipeline receipts increased in August by 30% compared to July and averaged 4.3 Bcf/d before Hurricane Laura made landfall on August 27. Two LNG export terminals—Sabine Pass and Cameron, which were in the direct path of the hurricane—have shut down operations. Since hurricane landfall, total U.S. LNG pipeline receipts have declined to an average of 2.8 Bcf/d during the report week (August 27 through September 2). Damage to electric transmission infrastructure near Cameron LNG could delay the restart of exports from the terminal for up to three weeks in September.
Although both Sabine Pass and Cameron terminals have not been able to load any cargoes since August 23, some loadings from Sabine Pass were re-routed to the Corpus Christi LNG terminal in Texas.
Elba Island in Georgia has loaded a cargo this month, the first one since January 2020. The facility consists of 10 small-scale Moveable Modular Liquefaction System (MMLS) units with a combined capacity of 0.33 Bcf/d. Unit 1 became operational in October 2019, and units 2 through 9 were placed in service sequentially through July 2020. Unit 10 is expected to be placed in service this month.
Storage:
The net injections into storage totaled 35 Bcf for the week ending August 28, compared with the five-year (2015–19) average net injections of 66 Bcf and last year's net injections of 77 Bcf during the same week. Working natural gas stocks totaled 3,455 Bcf, which is 407 Bcf more than the five-year average and 538 Bcf more than last year at this time.
According to The Desk survey of natural gas analysts, estimates of the weekly net change to working natural gas stocks ranged from net injections of 28 Bcf to 43 Bcf, with a median estimate of 34 Bcf.
The average rate of injections into storage is 7% higher than the five-year average so far in the refill season (April through October). If the rate of injections into storage matched the five-year average of 10.5 Bcf/d for the remainder of the refill season, the total inventory would be 4,130 Bcf on October 31, which is 407 Bcf higher than the five-year average of 3,723 Bcf for that time of year.
More storage data and analysis can be found on the Natural Gas Storage Dashboard and the Weekly Natural Gas Storage Report.
See also:


| Spot Prices ($/MMBtu) | Thu, 27-Aug |
Fri, 28-Aug |
Mon, 31-Aug |
Tue, 01-Sep |
Wed, 02-Sep |
|---|---|---|---|---|---|
| Henry Hub | 2.51 | 2.46 | 2.24 | 2.21 | 2.19 |
| New York | 1.62 | 1.09 | 1.31 | 1.37 | 1.76 |
| Chicago | 2.28 | 2.18 | 2.07 | 2.09 | 2.17 |
| Cal. Comp. Avg.* | 3.32 | 3.25 | 2.97 | 2.91 | 3.05 |
| Futures ($/MMBtu) | |||||
| September Contract | 2.579 | Expired | Expired | Expired | Expired |
| October Contract | 2.710 | 2.657 | 2.630 | 2.527 | 2.486 |
| November Contract | 2.943 | 2.916 | 2.920 | 2.901 | 2.931 |
| *Avg. of NGI's reported prices for: Malin, PG&E Citygate, and Southern California Border Avg. | |||||
| Source: NGI's Daily Gas Price Index | |||||


| U.S. natural gas supply - Gas Week: (8/27/20 - 9/2/20) | |||
|---|---|---|---|
Average daily values (Bcf/d): |
|||
this week |
last week |
last year |
|
| Marketed production | 100.0 |
100.0 |
104.4 |
| Dry production | 88.5 |
88.5 |
92.5 |
| Net Canada imports | 4.5 |
5.2 |
4.2 |
| LNG pipeline deliveries | 0.1 |
0.1 |
0.1 |
| Total supply | 93.1 |
93.8 |
96.7 |
|
Source: IHS Markit | |||
| U.S. natural gas consumption - Gas Week: (8/27/20 - 9/2/20) | |||
|---|---|---|---|
Average daily values (Bcf/d): |
|||
this week |
last week |
last year |
|
| U.S. consumption | 66.4 |
70.2 |
67.9 |
| Power | 38.0 |
41.2 |
38.4 |
| Industrial | 20.3 |
20.4 |
21.3 |
| Residential/commercial | 8.1 |
8.5 |
8.2 |
| Mexico exports | 6.0 |
6.1 |
5.5 |
| Pipeline fuel use/losses | 6.7 |
6.8 |
7.0 |
| LNG pipeline receipts | 2.8 |
4.2 |
6.4 |
| Total demand | 81.9 |
87.3 |
86.9 |
|
Source: IHS Markit | |||


| Rigs | |||
|---|---|---|---|
Tue, August 25, 2020 |
Change from |
||
last week |
last year |
||
| Oil rigs | 180 |
-1.6% |
-75.7% |
| Natural gas rigs | 72 |
4.3% |
-55.6% |
| Note: Excludes any miscellaneous rigs | |||
| Rig numbers by type | |||
|---|---|---|---|
Tue, August 25, 2020 |
Change from |
||
last week |
last year |
||
| Vertical | 13 |
0.0% |
-74.0% |
| Horizontal | 221 |
0.0% |
-71.8% |
| Directional | 20 |
0.0% |
-71.4% |
| Source: Baker Hughes Co. | |||
| Working gas in underground storage | ||||
|---|---|---|---|---|
Stocks billion cubic feet (Bcf) |
||||
| Region | 2020-08-28 |
2020-08-21 |
change |
|
| East | 789 |
775 |
14 |
|
| Midwest | 924 |
904 |
20 |
|
| Mountain | 212 |
212 |
0 |
|
| Pacific | 304 |
306 |
-2 |
|
| South Central | 1,225 |
1,223 |
2 |
|
| Total | 3,455 |
3,420 |
35 |
|
|
Source: Form EIA-912, Weekly Underground Natural Gas Storage Report | ||||
| Working gas in underground storage | |||||
|---|---|---|---|---|---|
Historical comparisons |
|||||
Year ago (8/28/19) |
5-year average (2015-2019) |
||||
| Region | Stocks (Bcf) |
% change |
Stocks (Bcf) |
% change |
|
| East | 705 |
11.9 |
734 |
7.5 |
|
| Midwest | 816 |
13.2 |
817 |
13.1 |
|
| Mountain | 176 |
20.5 |
190 |
11.6 |
|
| Pacific | 277 |
9.7 |
295 |
3.1 |
|
| South Central | 943 |
29.9 |
1,013 |
20.9 |
|
| Total | 2,917 |
18.4 |
3,048 |
13.4 |
|
| Source: Form EIA-912, Weekly Underground Natural Gas Storage Report | |||||
| Temperature – heating & cooling degree days (week ending Aug 27) | ||||||||
|---|---|---|---|---|---|---|---|---|
HDD deviation from: |
CDD deviation from: |
|||||||
| Region | HDD Current |
normal |
last year |
CDD Current |
normal |
last year |
||
| New England | 5 |
-2 |
-9 |
45 |
20 |
28 |
||
| Middle Atlantic | 0 |
-4 |
-5 |
70 |
32 |
47 |
||
| E N Central | 0 |
-7 |
-12 |
76 |
39 |
56 |
||
| W N Central | 0 |
-10 |
-11 |
81 |
31 |
47 |
||
| South Atlantic | 0 |
-1 |
0 |
101 |
17 |
14 |
||
| E S Central | 0 |
-1 |
0 |
87 |
8 |
4 |
||
| W S Central | 0 |
0 |
0 |
117 |
3 |
-13 |
||
| Mountain | 0 |
-12 |
-1 |
95 |
31 |
13 |
||
| Pacific | 1 |
-4 |
0 |
70 |
28 |
4 |
||
| United States | 0 |
-5 |
-5 |
84 |
24 |
23 |
||
|
Note: HDD = heating degree day; CDD = cooling degree day Source: National Oceanic and Atmospheric Administration | ||||||||
Average temperature (°F)
7-day mean ending Aug 27, 2020

Source: National Oceanic and Atmospheric Administration
Deviation between average and normal (°F)
7-day mean ending Aug 27, 2020
Source: National Oceanic and Atmospheric Administration
