In the News:
U.S. net natural gas exports grow through 2021
The U.S. Energy Information Administration’s (EIA) Short-Term Energy Outlook (STEO), released on January 14, forecasts the United States to remain a net exporter of natural gas through 2021. Net natural gas exports are forecast to average 7.3 billion cubic feet per day (Bcf/d) in 2020 and 8.9 Bcf/d in 2021, a 3.6 Bcf/d increase from 2019. In 2017, the United States became a net natural gas exporter on an annual basis for the first time in 60 years.
Strong natural gas export growth in recent years is mainly the result of increased exports of liquefied natural gas (LNG). U.S. LNG exports averaged 5.0 Bcf/d in 2019, 2.0 Bcf/d higher than in 2018, as a result of several new facilities placing their first liquefaction units—referred to as trains—in service. This year, several new trains are expected to begin operations: Trains 2 and 3 at Cameron LNG in Louisiana, Train 3 at Freeport LNG in Texas, and six remaining Moveable Modular Liquefaction System (MMLS) units (Trains 5–10) at Elba Island in Georgia. In 2021, the third train at the Corpus Christi facility in Texas is scheduled to come online, bringing the total U.S. liquefaction baseload capacity to 10.2 Bcf/d. LNG exports are projected to continue to grow—averaging 6.5 Bcf/d in 2020 and 7.7 Bcf/d in 2021—as facilities gradually ramp up to full production.
EIA also forecasts that pipeline exports will continue to grow through 2021. Gross U.S. pipeline exports rise from 7.8 Bcf/d in 2019 to 8.1 Bcf/d in 2020 and to 8.5 Bcf/d in 2021.
U.S. pipeline exports to Mexico began increasing after expansions of cross-border pipeline capacity were completed. From January through October 2019, U.S. pipeline exports to Mexico averaged 5.1 Bcf/d, which is 0.5 Bcf/d higher than the 2018 annual average, according to EIA’s Natural Gas Monthly. This increase in exports was primarily the result of increased flows on the newly commissioned Sur de Texas–Tuxpan pipeline in Mexico, which transports natural gas from Texas to the southern Mexico state of Veracruz. Several new pipelines in Mexico that were expected to come online in 2019 were delayed and are forecast to enter service in 2020. These pipelines include the 1.2 Bcf/d La Laguna–Aguascalientes and 0.9 Bcf/d Villa de Reyes–Aguascalientes–Guadalajara pipelines in Central and Southwest Mexico and the 0.5 Bcf/d Samalayuca–Sásabe in Western Mexico. Once these pipelines come online, U.S. pipeline exports to Mexico are projected to further increase.
Although U.S. net natural gas pipeline imports from Canada have been steadily declining since 2016, the United States is projected to remain a net natural gas importer from Canada through the long-term because imports from Canada will remain a supply source for the United States during the winter. Despite new supplies from Appalachia that have been displacing pipeline imports from western Canada into the Midwest and an increase of U.S. pipeline exports to Canada following Phase 2 of the Rover pipeline and the NEXUS pipeline entering service in late 2018, the United States will continue to import more natural gas from Canada than it exports.
Overview:
(For the week ending Wednesday, January 15, 2019)
- Natural gas spot price movements were mixed this report week (Wednesday, January 8 to Wednesday, January 15). The Henry Hub spot price fell from $2.08 per million British thermal units (MMBtu) last Wednesday to $1.98/MMBtu yesterday.
- At the New York Mercantile Exchange (Nymex), the price of the February 2020 contract decreased 2¢, from $2.141/MMBtu last Wednesday to $2.120/MMBtu yesterday. The price of the 12-month strip averaging February 2020 through January 2021 futures contracts declined 3¢/MMBtu to $2.290/MMBtu.
- The net withdrawal from working gas totaled 109 billion cubic feet (Bcf) for the week ending January 10. Working natural gas stocks total 3,039 Bcf, which is 19% more than the year-ago level and 5% more than the five-year (2015–19) average for this week.
- The natural gas plant liquids composite price at Mont Belvieu, Texas, fell by 2¢/MMBtu, averaging $5.05/MMBtu for the week ending January 15. The prices of natural gasoline, propane, and isobutane fell by 4%, 1%, and 1%, respectively. The prices of ethane and butane rose by 4% and 2%, respectively.
- According to Baker Hughes, for the week ending Tuesday, January 7, the natural gas rig count decreased by 4 to 119. The number of oil-directed rigs fell by 11 to 659. The total rig count decreased by 15, and it now stands at 781.
Prices/Supply/Demand:
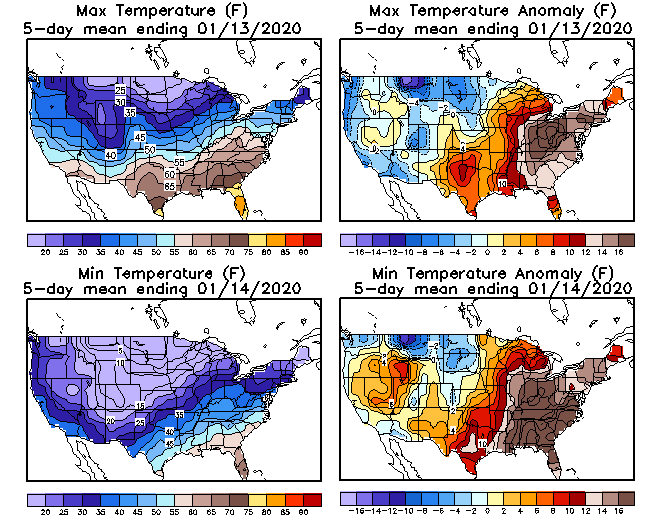
The Henry Hub spot price falls to less than $2. This report week (Wednesday, January 8 to Wednesday, January 15), the Henry Hub spot price fell 10¢ from $2.08/MMBtu last Wednesday to a low of $1.98/MMBtu yesterday, the lowest spot price since April 2016 and the lowest spot price for Henry Hub in January trading since 1999. Temperatures were much warmer than normal across most of the Lower 48 states, generally putting downward pressure on prices. At the Chicago Citygate, the price was unchanged from last Wednesday at $1.97/MMBtu.
California prices fall. The price at PG&E Citygate in Northern California fell 18¢, down from $3.32/MMBtu last Wednesday to a low of $3.14/MMBtu yesterday. The price at SoCal Citygate in Southern California decreased 39¢ from $4.80/MMBtu last Wednesday to a low of $4.41/MMBtu yesterday. Prices have been elevated in Southern California in recent weeks because of high demand and withdrawals from storage.
Northeast prices rise with forecasts of heavy snow. At the Algonquin Citygate, which serves Boston-area consumers, the price went up $1.55 from $2.91/MMBtu last Wednesday to a high of $4.46/MMBtu yesterday. Prices rose amid falling temperatures and forecasts of heavy snow for this weekend, reversing a trend of unseasonably warm temperatures during the report week. At the Transcontinental Pipeline Zone 6 trading point for New York City, the price decreased 1¢ from $2.17/MMBtu last Wednesday to $2.16/MMBtu yesterday.
The Tennessee Zone 4 Marcellus spot price increased 13¢ from $1.70/MMBtu last Wednesday to $1.83/MMBtu yesterday. The price at Dominion South in southwest Pennsylvania rose 8¢ from $1.71/MMBtu last Wednesday to $1.79/MMBtu yesterday.
Discount at Permian Basin trading hub persists. The price at the Waha Hub in West Texas, which is located near Permian Basin production activities, averaged $0.64/MMBtu last Wednesday, $1.44/MMBtu lower than the Henry Hub price. Yesterday, the price at the Waha Hub averaged $0.61/MMBtu, $1.37/MMBtu lower than the Henry Hub price.
Supply falls as the United States imports less natural gas from Canada. According to data from IHS Markit, the average total supply of natural gas fell by 1% compared with the previous report week. Dry natural gas production remained constant week over week. Average net imports from Canada decreased by 25% from last week with warmer-than-normal temperatures and lower demand in Midwest and Northeast markets.
Demand falls, primarily in power and buildings sectors. Total U.S. consumption of natural gas fell by 3% compared with the previous report week, according to data from IHS Markit. Natural gas consumed for power generation declined by 3% week over week. Industrial sector consumption decreased by 1% week over week. In the residential and commercial sectors, consumption declined by 4%. According to Genscape, natural gas exports to Mexico increased 5% as deliveries increased to Mexico’s Sur de Texas-Tuxpan pipeline at Brownsville, Texas.
U.S. LNG exports decrease week over week. Fourteen LNG vessels (seven from Sabine Pass; two each from Corpus Christi, Cove Point, and Cameron; and one from Freeport) with a combined LNG-carrying capacity of 51 Bcf departed the United States between January 9 and January 15, 2020, according to shipping data compiled by Bloomberg.
On December 30, 2019, the Federal Energy Regulatory Commission issued an order authorizing the developers of Elba Island LNG facility in Georgia to “commence service for liquefaction and export activities from the Moveable Modular Liquefaction System No. 4.” Elba Island LNG exported its first LNG cargo on December 13, 2019, and is in the process of commissioning the remaining Units 5 through 10 at the facility, scheduled to come online by mid-2020.
Storage:
The net withdrawal from storage totaled 109 Bcf for the week ending January 10, compared with the five-year (2015–19) average net withdrawal of 184 Bcf and last year's net withdrawal of 82 Bcf during the same week. Working natural gas stocks totaled 3,039 Bcf, which is 149 Bcf more than the five-year average and 494 Bcf more than last year at this time.
The average rate of withdrawal from storage is 15% lower than the five-year average so far in the withdrawal season (November through March). If the rate of withdrawal from storage matched the five-year average of 14.7 Bcf/d for the remainder of the withdrawal season, the total inventory would be 1,846 Bcf on March 31, which is 149 Bcf higher than the five-year average of 1,697 Bcf for that time of year.
According to The Desk survey of natural gas analysts, estimates of the weekly net change to working natural gas stocks ranged from a net withdrawal of 87 Bcf to 106 Bcf, with a median estimate of 95 Bcf.
More storage data and analysis can be found on the Natural Gas Storage Dashboard and the Weekly Natural Gas Storage Report.
See also:


| Spot Prices ($/MMBtu) | Thu, 09-Jan |
Fri, 10-Jan |
Mon, 13-Jan |
Tue, 14-Jan |
Wed, 15-Jan |
|---|---|---|---|---|---|
| Henry Hub |
2.01 |
2.06 |
2.07 |
2.13 |
1.98 |
| New York |
1.84 |
1.67 |
2.03 |
2.05 |
2.16 |
| Chicago |
1.95 |
2.02 |
2.04 |
2.06 |
1.97 |
| Cal. Comp. Avg.* |
2.82 |
2.85 |
2.85 |
2.88 |
2.61 |
| Futures ($/MMBtu) | |||||
| February contract | 2.166 |
2.202 |
2.182 |
2.187 |
2.120 |
| March contract |
2.148 |
2.168 |
2.158 |
2.151 |
2.083 |
| *Avg. of NGI's reported prices for: Malin, PG&E Citygate, and Southern California Border Avg. | |||||
| Source: NGI's Daily Gas Price Index | |||||


| U.S. natural gas supply - Gas Week: (1/9/20 - 1/15/20) | |||
|---|---|---|---|
Average daily values (Bcf/d): |
|||
this week |
last week |
last year |
|
| Marketed production | 108.6 |
108.8 |
99.7 |
| Dry production | 95.7 |
95.9 |
88.4 |
| Net Canada imports | 3.3 |
4.4 |
6.2 |
| LNG pipeline deliveries | 0.2 |
0.2 |
0.3 |
| Total supply | 99.1 |
100.4 |
95.0 |
|
Source: IHS Markit | |||
| U.S. natural gas consumption - Gas Week: (1/9/20 - 1/15/20) | |||
|---|---|---|---|
Average daily values (Bcf/d): |
|||
this week |
last week |
last year |
|
| U.S. consumption | 90.6 |
93.4 |
99.4 |
| Power | 26.3 |
27.2 |
26.8 |
| Industrial | 24.5 |
24.7 |
25.6 |
| Residential/commercial | 39.9 |
41.5 |
47.0 |
| Mexico exports | 5.3 |
5.1 |
4.9 |
| Pipeline fuel use/losses | 7.3 |
7.3 |
7.1 |
| LNG pipeline receipts | 8.2 |
8.2 |
4.8 |
| Total demand | 111.5 |
114.0 |
116.2 |
|
Source: IHS Markit | |||


| Rigs | |||
|---|---|---|---|
Tue, January 07, 2020 |
Change from |
||
last week |
last year |
||
| Oil rigs | 659 |
-1.6% |
-24.5% |
| Natural gas rigs | 119 |
-3.3% |
-41.1% |
| Note: Excludes any miscellaneous rigs | |||
| Rig numbers by type | |||
|---|---|---|---|
Tue, January 07, 2020 |
Change from |
||
last week |
last year |
||
| Vertical | 38 |
-13.6% |
-41.5% |
| Horizontal | 698 |
-0.4% |
-26.4% |
| Directional | 45 |
-11.8% |
-27.4% |
| Source: Baker Hughes Inc. | |||
| Working gas in underground storage | ||||
|---|---|---|---|---|
Stocks billion cubic feet (Bcf) |
||||
| Region | 2020-01-10 |
2020-01-03 |
change |
|
| East | 716 |
756 |
-40 |
|
| Midwest | 851 |
885 |
-34 |
|
| Mountain | 161 |
166 |
-5 |
|
| Pacific | 235 |
244 |
-9 |
|
| South Central | 1,076 |
1,097 |
-21 |
|
| Total | 3,039 |
3,148 |
-109 |
|
|
Source: Form EIA-912, Weekly Underground Natural Gas Storage Report | ||||
| Working gas in underground storage | |||||
|---|---|---|---|---|---|
Historical comparisons |
|||||
Year ago (1/10/19) |
5-year average (2015-2019) |
||||
| Region | Stocks (Bcf) |
% change |
Stocks (Bcf) |
% change |
|
| East | 624 |
14.7 |
677 |
5.8 |
|
| Midwest | 734 |
15.9 |
796 |
6.9 |
|
| Mountain | 128 |
25.8 |
159 |
1.3 |
|
| Pacific | 197 |
19.3 |
256 |
-8.2 |
|
| South Central | 862 |
24.8 |
1,002 |
7.4 |
|
| Total | 2,545 |
19.4 |
2,890 |
5.2 |
|
| Source: Form EIA-912, Weekly Underground Natural Gas Storage Report | |||||
| Temperature – heating & cooling degree days (week ending Jan 09) | ||||||||
|---|---|---|---|---|---|---|---|---|
HDD deviation from: |
CDD deviation from: |
|||||||
| Region | HDD Current |
normal |
last year |
CDD Current |
normal |
last year |
||
| New England | 218 |
-52 |
-1 |
0 |
0 |
0 |
||
| Middle Atlantic | 208 |
-50 |
7 |
0 |
0 |
0 |
||
| E N Central | 218 |
-74 |
22 |
0 |
0 |
0 |
||
| W N Central | 235 |
-82 |
26 |
0 |
0 |
0 |
||
| South Atlantic | 135 |
-47 |
25 |
7 |
0 |
-2 |
||
| E S Central | 131 |
-58 |
23 |
0 |
-2 |
0 |
||
| W S Central | 88 |
-53 |
-4 |
1 |
-2 |
-1 |
||
| Mountain | 199 |
-37 |
-13 |
0 |
0 |
0 |
||
| Pacific | 109 |
-16 |
-12 |
0 |
0 |
0 |
||
| United States | 172 |
-52 |
9 |
2 |
0 |
0 |
||
|
Note: HDD = heating degree day; CDD = cooling degree day Source: National Oceanic and Atmospheric Administration | ||||||||
Average temperature (°F)
7-day mean ending Jan 09, 2020

Source: National Oceanic and Atmospheric Administration
Deviation between average and normal (°F)
7-day mean ending Jan 09, 2020
Source: National Oceanic and Atmospheric Administration
