In the News:
Natural gas storage sees first net withdrawal of season
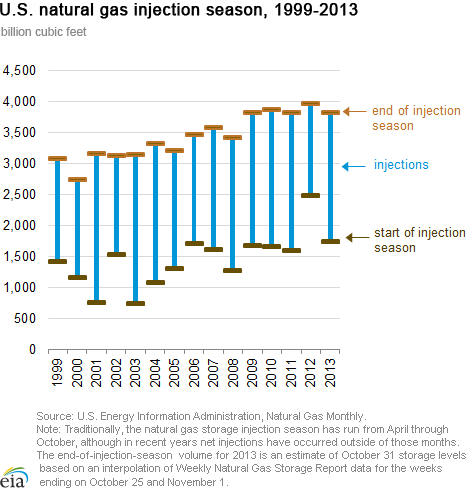
EIA earlier today reported the first net natural gas withdrawal of the heating season from Lower 48 storage facilities. This report covered the week ending November 15, following several days of cold weather-driven gas demand in the Northeast and Midwest. Stock levels recorded on November 8 of 3,834 billion cubic feet (Bcf) would mark the 2013 natural gas inventory peak if storage withdrawals continue in the coming weeks. Working natural gas inventory levels on November 8 were 84 Bcf below year ago inventories, and marked the fifth-highest annual level recorded by EIA, following a recent trend of high inventories at the start of winter.
Inventories started the injection season in April at 1,724 Bcf, more than 30% below the April 2012 level. This was largely a reflection of the record-high levels at the start of the injection season in 2012, following a warm winter with reduced residential and commercial consumption for heating coupled with robust production. Although inventories have remained below 2012 levels, the year-over-year deficit recorded at the beginning of the injection season was nearly overcome by average weekly injections through November 8 that were 44% higher in 2013 than 2012. This was largely a result of modest increases in natural gas production combined with a reduction of natural gas consumed for power generation (power burn) this year compared to 2012.
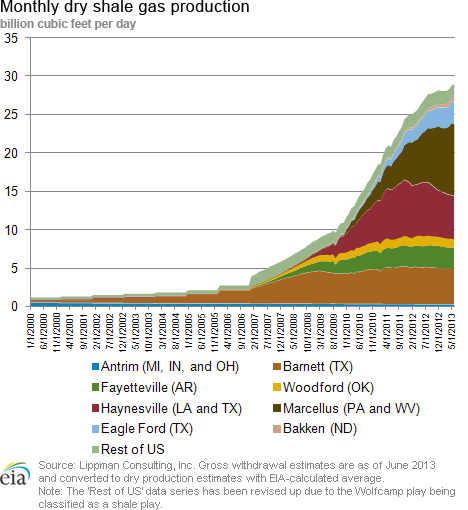
Natural gas consumption over the April-through-October period this year was 2.9 Bcf/d lower than in 2012. A combination of higher natural gas prices relative to coal prices and cooler summer weather compared to last year contributed to a 14%, or 3.9 Bcf/d, year-on-year decline in average natural gas power burn. This more than offset a 1.0 Bcf/d rise in consumption from other sectors. Lower demand was accompanied by higher supply, with dry natural gas production from April through October of this year topping 2012 levels by an average of 1.3 Bcf/d, more than offsetting a 0.8 Bcf/d yearly decline in net imports.
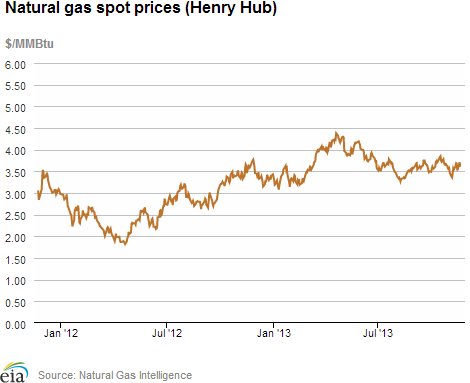
In 2012, a combination of high inventory levels and continued strong production contributed to Henry Hub spot prices falling to a low of $1.82 per million British thermal units on April 20. With low prices, and limited storage capacity, natural gas consumption in the electric power sector increased significantly in 2012 over recent years. Since then, gas prices have generally remained higher than year-ago levels.
Overview:
(For the Week Ending Wednesday, November 20, 2013)
- Natural gas spot prices fell slightly over most of the country, with the exception of prices in the Northeast. The Henry Hub spot price declined from $3.68/MMBtu last Wednesday, November 13, to $3.62/MMBtu yesterday.
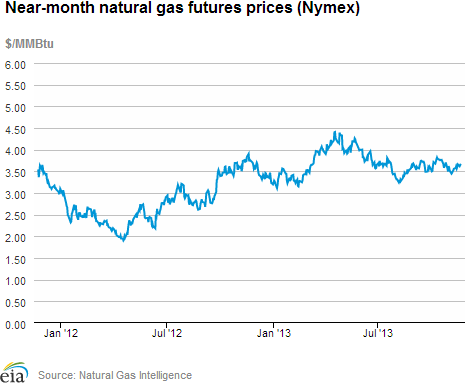
- At the New York Mercantile Exchange, however, the December 2013 contract rose from $3.566/MMBtu last Wednesday to $3.674 yesterday.
- Working natural gas in storage decreased to 3,789 Bcf as of Friday, November 15, according to the U.S. Energy Information Administration's (EIA) Weekly Natural Gas Storage Report (WNGSR). Marking the first storage withdrawal of the 2013-14 heating season, stocks declined by 45 Bcf for the week, resulting in storage levels 2.3% below year-ago levels, but 0.4% above the 5-year average.
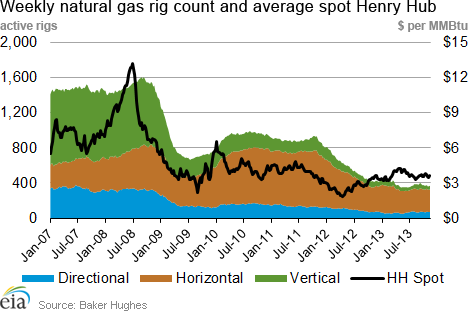
- The Baker Hughes natural gas rotary rig count totaled 370 this week, an increase of 5 from the previous week, according to data released November 15 by Baker Hughes Inc. The oil rig count rose by 2 to 1,385 active units. The total rig count is 1,762, up 8 rigs from the previous week and down 47 from a year ago.
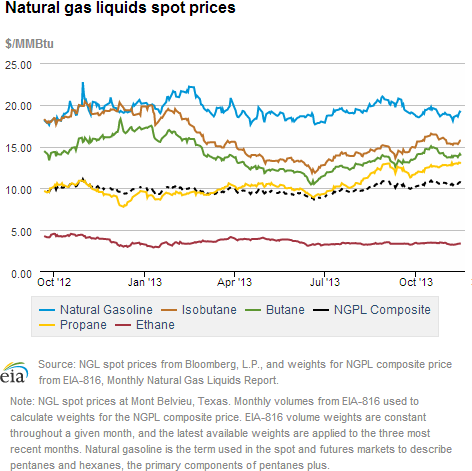
- The weekly average natural gas plant liquids composite price rose this week (covering November 11 through November 15) compared to the previous week by 1.6%, and is now at $10.65/MMBtu. Ethane rose by 3.2%, while natural gasoline, propane, and isobutane rose by between 1% and 3%. Butane increased by 0.9%.
Prices/Demand/Supply:
For the most part, price movements were moderate. The Henry Hub price fell slightly from $3.68/MMBtu last Wednesday to $3.62 yesterday. Within the week, Henry Hub prices fluctuated between a low of $3.52/MMBtu Thursday to a high of $3.71/MMBtu Monday. Price movements in most of the rest of the country were similar, with most pricing locations posting a slight net decline for the week. Cold temperatures are expected in the coming week; however, continued strong production and storage levels may help to mute potential price increases.
Cold winter temperatures boosted Boston prices substantially. Unlike most of the rest of the country, New England has infrastructure constraints that often lead to sharp price increases in times of high demand. At the Algonquin Citygate, which serves Boston consumers, prices rose to $6.30/MMBtu Tuesday, up more than $1.50/MMBtu from the beginning of the report week. Similarly, on Tennessee Pipeline's Zone 6 Line 200, which serves New England consumers, prices increased from $4.69/MMBtu at the beginning of the report week to $6.30/MMBtu Tuesday, before falling below $5/MMBtu on Wednesday. According to Bentek Energy, total demand in the Northeast increased from 13.1 Bcf/d Monday to 19.3 Bcf/d Tuesday.
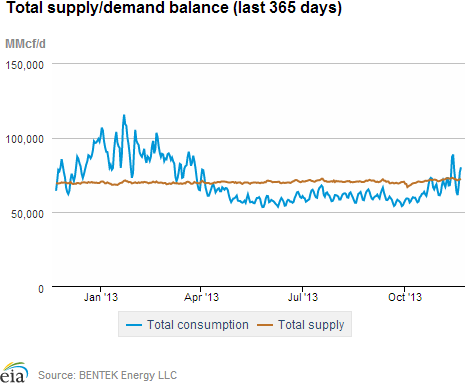
Despite increases in the Northeast, overall consumption was down. Total natural gas consumption fell 6%, representing overall week-over-week declines in industrial, residential/commercial, and natural gas used for power generation. Though weekly data show an overall decline, daily data show a strong uptick in consumption at the end of the report week (likely related to colder weather at the end of the week).
Total supply declined 1.1% over the week. Total U.S. dry gas production fell by 0.8% week-over-week but remains 3% greater than the same time last year. Imports from Canada declined 5%, and LNG sendout remained at minimal levels.
Near-month (December 2013) natural gas futures contract price rose. The futures price began the week at $3.566/MMBtu, oscillated between the mid-$3.50s and mid-$3.60s, and ended the week up nearly 11 cents at $3.674/MMBtu. The 12-month strip (the average of the 12 contracts between December 2013 and November 2014) behaved similarly, rising from $3.665/MMBtu last Wednesday to $3.751/MMBtu yesterday.
Storage
Gas storage sees first net withdrawal this season. The net withdrawal reported this week was 45 Bcf, 9 Bcf larger than last year's withdrawal of 36 Bcf and 43 Bcf larger than the 5-year average withdrawal of 2 Bcf. Current inventories totaling 3,789 Bcf are 89 Bcf (2.3%) less than last year at this time, but 15 Bcf (0.4%) above the 5-year (2008-12) average of 3,774 Bcf.
Net withdrawal is larger than expected. When the EIA storage report was released, there was a slight increase in prices for natural gas futures on the New York Mercantile Exchange. At 10:30 a.m., the price of the near-month (December 2013) contract rose 3 cents to $3.73/MMBtu, and remained near that level in the hour following trading.
All three regions post decreases this week. Only the East region remains below its 5-year average and its year ago levels. Net withdrawals in the East region were 31 Bcf this week, 25 Bcf larger than its 5-year average withdrawal of 6 Bcf, and 12 Bcf larger than its year-ago withdrawal of 19 Bcf. The Producing region and the West region had net withdrawals of 13 Bcf this week and 1 Bcf, respectively.
Cooler weather prompts storage withdrawal. Temperatures in the Lower 48 states averaged 45.7 degrees for the week, 1.9 degrees cooler than the 30-year normal temperature and 2.0 degrees cooler than the same period last year.
See also:
| Spot Prices ($/MMBtu) | Thu, 14-Nov |
Fri, 15-Nov |
Mon, 18-Nov |
Tue, 19-Nov |
Wed, 20-Nov |
|---|---|---|---|---|---|
| Henry Hub | 3.52 |
3.56 |
3.71 |
3.62 |
3.62 |
| New York | 3.43 |
3.10 |
3.79 |
3.76 |
3.68 |
| Chicago | 3.56 |
3.63 |
3.73 |
3.66 |
3.69 |
| Cal. Comp. Avg,* | 3.54 |
3.66 |
3.77 |
3.68 |
3.67 |
| Futures ($/MMBtu) | |||||
| December Contract | 3.605 |
3.660 |
3.617 |
3.556 |
3.674 |
| January Contract | 3.655 |
3.708 |
3.667 |
3.605 |
3.713 |
*Avg. of NGI's reported prices for: Malin, PG&E citygate, and Southern California Border Avg. |
| Source: NGI's Daily Gas Price Index | |||||
| U.S. Natural Gas Supply - Gas Week: (11/13/13 - 11/20/13) | ||
|---|---|---|
Percent change for week compared with: |
||
last year |
last week |
|
| Gross Production | 3.01%
|
-0.78%
|
| Dry Production | 2.99%
|
-0.77%
|
| Canadian Imports | 14.73%
|
-4.98%
|
| West (Net) | 3.26%
|
1.37%
|
| MidWest (Net) | 90.57%
|
-2.41%
|
| Northeast (Net) | -50.12%
|
-34.07%
|
| LNG Imports | -45.29%
|
-4.32%
|
| Total Supply | 3.47%
|
-1.09%
|
| Source: BENTEK Energy LLC | ||
| U.S. Consumption - Gas Week: (11/13/13 - 11/20/13) | ||
|---|---|---|
Percent change for week compared with: |
||
last year |
last week |
|
| U.S. Consumption | -2.21%
|
-5.96%
|
| Power | -2.83%
|
-7.62%
|
| Industrial | -0.66%
|
-2.11%
|
| Residential/Commercial | -2.96%
|
-7.48%
|
| Total Demand | -1.68%
|
-5.76%
|
| Source: BENTEK Energy LLC | ||
| Rigs | |||
|---|---|---|---|
Fri, November 08, 2013 |
Change from |
||
last week |
last year |
||
| Oil Rigs | 1,385 |
0.14% |
-0.36% |
| Natural Gas Rigs | 370 |
1.37% |
-11.27% |
| Miscellaneous | 7 |
16.67% |
250.00% |
| Rig Numbers by Type | |||
|---|---|---|---|
Fri, November 08, 2013 |
Change from |
||
last week |
last year |
||
| Vertical | 428 |
2.64% |
-16.08% |
| Horizontal | 1,114 |
0.00% |
0.81% |
| Directional | 220 |
-1.35% |
13.99% |
| Source: Baker Hughes Inc. | |||
| Working Gas in Underground Storage | ||||
|---|---|---|---|---|
Stocks billion cubic feet (bcf) |
||||
| Region | 11/8/13
|
11/1/13
|
change |
|
| East | 1,984 |
1,974 |
10
|
|
| West | 553 |
555 |
-2
|
|
| Producing | 1,297 |
1,285 |
12
|
|
| Total | 3,834 |
3,814 |
20
|
|
| Source: U.S. Energy Information Administration | ||||
| Working Gas in Underground Storage | |||||
|---|---|---|---|---|---|
Historical Comparisons |
|||||
Year ago (11/8/12) |
5-year average (2008-2012) |
||||
| Region | Stocks (Bcf) |
% change |
Stocks (Bcf) |
% change |
|
| East | 2,076 |
-4.4 |
2,077 |
-4.5 |
|
| West | 551 |
0.4 |
514 |
7.6 |
|
| Producing | 1,287 |
0.8 |
1,185 |
9.5 |
|
| Total | 3,914 |
-2.0 |
3,776 |
1.5 |
|
| Source: U.S. Energy Information Administration | |||||
| Temperature -- Heating & Cooling Degree Days (week ending Nov 14) | ||||||||
|---|---|---|---|---|---|---|---|---|
HDD deviation from: |
CDD deviation from: |
|||||||
| Region | HDD Current |
normal |
last year |
CDD Current |
normal |
last year |
||
| New England | 183
|
30
|
39
|
0
|
0
|
0
|
||
| Middle Atlantic | 177
|
33
|
31
|
0
|
0
|
0
|
||
| E N Central | 194
|
30
|
47
|
0
|
0
|
0
|
||
| W N Central | 196
|
15
|
39
|
0
|
0
|
0
|
||
| South Atlantic | 130
|
36
|
27
|
14
|
0
|
6
|
||
| E S Central | 138
|
42
|
33
|
0
|
-2
|
0
|
||
| W S Central | 85
|
23
|
35
|
3
|
-5
|
-15
|
||
| Mountain | 114
|
-48
|
-50
|
6
|
5
|
3
|
||
| Pacific | 37
|
-42
|
-60
|
0
|
-1
|
0
|
||
| United States | 138
|
12
|
14
|
3
|
-1
|
0
|
||
|
Note: HDD = heating degree-day; CDD = cooling degree-day Source: National Oceanic and Atmospheric Administration | ||||||||
Average temperature (°F)
7-Day Mean ending Nov 14, 2013
Source: NOAA/National Weather Service
Deviation between average and normal (°F)
7-Day Mean ending Nov 14, 2013
Source: NOAA/National Weather Service