In the News:
Summer storage injections higher than last year, on par with five-year average
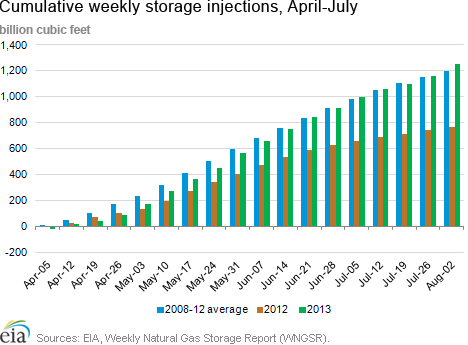
Following last week's net storage injection of 96 billion cubic feet (Bcf), total natural gas working inventories in the Lower 48 states reached 2,941 Bcf, surpassing the five-year average from 2008 to 2012 for the first time since the week ending on March 22, 2013. Storage injections during the first four months of the 2013 summer injection season (April through July) totaled 1,254 Bcf. While this represents a 63% increase over cumulative storage injections for the same period last year, it is only 5% above injections from 2008 to 2012.The differences in storage injections reflect two key variables: (1) lower natural gas consumption by electric generators (power burn) in summer 2013 compared to 2012; and (2) starting inventories on April 1 that were 31% below last year's record of 2,477 Bcf, providing more open storage capacity for injections to occur.
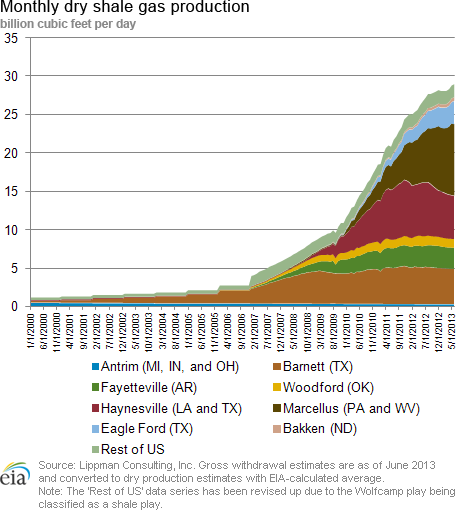
In April-July 2013, natural gas power burn averaged 23.4 billion cubic feet per day (Bcf/d), an 18% decrease from 2012 levels, according to data from Bentek Energy. This occurred because of a combination of cooler temperatures in 2013 combined with higher prices. Average U.S. temperatures in April through July 2013 decreased 3% year-on-year to 68.2 degrees Fahrenheit, leading to less overall power demand. As this occurred, the average Henry Hub spot price rose 63% over year-ago levels to $3.92 per MMBtu, reducing demand for natural gas from power sector consumers. However, April-July prices this year remained 25% below 2008-12 levels, with power burn 4% higher, residential and commercial consumption 9% higher, industrial consumption 5% higher and net imports 43% lower, keeping injections flat against the five-year average despite an 11% increase in production. EIA's August Short-Term Energy Outlook forecasts that natural gas in storage will end the injection season on October 31 with stock levels at 3,800 Bcf, 3.3% below the level for the same date in 2012 but 1.1% above the five-year average.Overview:
(For the Week Ending Wednesday, August 7 , 2013)
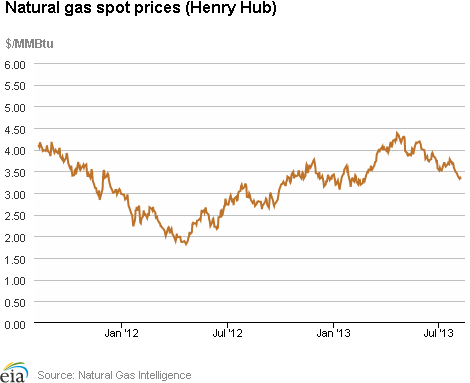
- With cooler-than-normal weather across most of the country this week, natural gas spot prices at most trading locations fell more than $0.20 per million British thermal unit (MMBtu) since last week (Wednesday, July 24, to Wednesday, July 31). The Henry Hub spot price ended the reporting week at $3.46 per MMBtu yesterday, down $0.24 from $3.70 per MMBtu at the beginning of the report period.
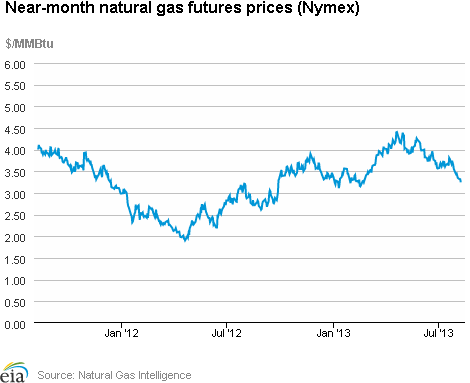
- At the New York Mercantile Exchange (Nymex), the price of the near-month (September 2013) contract fell $0.25 cents, from $3.698 per MMBtu last Wednesday to $3.446 yesterday.
- Working natural gas in storage increased to 2,845 Bcf as of Friday, July 26, according to the U.S. Energy Information Administration's (EIA) Weekly Natural Gas Storage Report (WNGSR). A net storage injection of 59 Bcf for the week resulted in storage levels 11.5% below a year ago and 1.2% below the 5-year average.
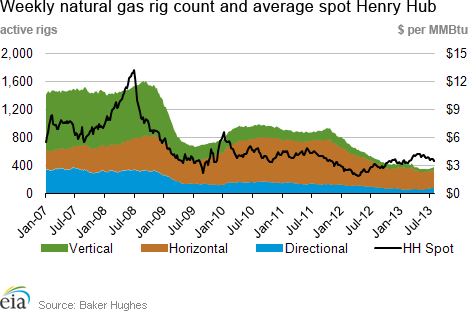
- The natural gas rotary rig count, as reported by Baker Hughes Incorporated, totaled 369 active units as of July 26, unchanged from the previous week. The oil rig count increased by 6 units to 1,401 rotary rigs.
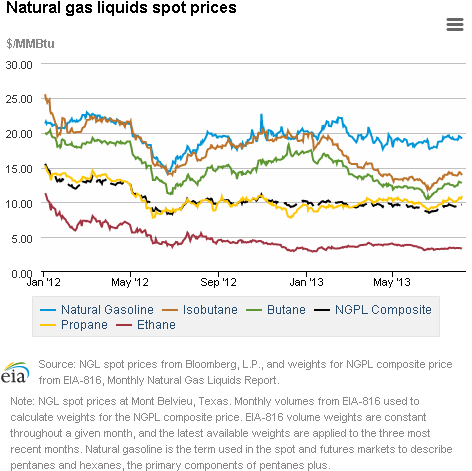
- The weekly average natural gas plant liquids composite price (covering July 22-26) decreased 1% from the previous week to $9.47 per MMBtu. The average weekly Mont Belvieu spot prices for natural gasoline, propane, and butane all fell by 2%, and isobutane fell by 1%. The ethane spot price increased by 2%.
Prices/Demand/Supply:
Prices tumbled over the report week as unseasonably cool weather spread across most of the country. Cooler temperatures and a corresponding decrease in demand for air conditioning contributed to declining prices at most trading points, particularly during trading on Friday and Monday. For example, prices at the Algonquin Citygate, which serves Boston, began the report week at $3.86 per MMBtu and fell by $0.26 per MMBtu by Friday's close, landing at $3.60 per MMBtu. At Transcontinental Pipeline's Zone 6 trading point for delivery into New York City, prices that had dropped $0.24 per MMBtu by Friday's close, fell an additional $0.16 per MMBtu in Monday's trading, settling at $3.34 per MMBtu.
Prices at the Henry Hub had similarly large decreases. The Henry Hub spot price, which started the report week at $3.70 per MMBtu, fell during every day of trading. The largest decreases occurred during trading on Friday and Monday when it lost a combined $0.21 per MMBtu. The Henry Hub price ended the report week at $3.46 per MMBtu, down $0.24 per MMBtu from the previous Wednesday. Similarly, the September contract, which moved into the near-month position Tuesday, fell $0.26 per MMBtu from $3.698 per MMBtu last Wednesday to $3.446 per MMBtu yesterday. The 12-Month Strip (average of September 2013 to August 2014 contracts) fell every day of the reporting period before ticking upward Tuesday, closing at $3.732 per MMBtu, down $0.156 per MMBtu for the week.
The weekly average natural gas plant liquids composite price (covering July 22-26) decreased 1% from the previous week to $9.47 per MMBtu. The ethane spot price, which has trended down in recent months, increased by 2% during the week covering July 22 through 26 compared to the week before. This was despite a few significant outages by receiving plants, such as the Clinton Ethylene plant in Iowa (for maintenance), and the Geismar Olefins facility in Louisiana (following an explosion in June). The price increase may be related to the July 21 opening of a Pennsylvania de-ethanizer that is now sending ethane to Sarnia, Ontario, as Range Resources announced in a recent press release. This facility is currently the only exporter of ethane in the country, though others are planned.
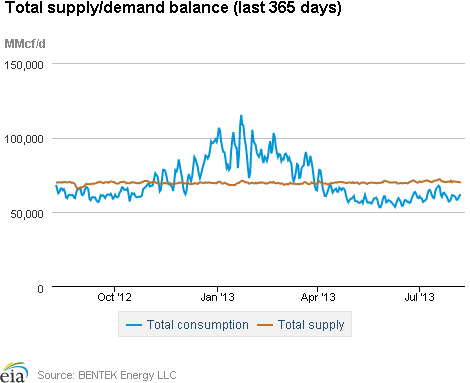
Falling power sector demand drove a consumption decrease of 6.5% over the report week. Consumption of natural gas for power generation (power burn) decreased 16.3% from the previous week, according to Bentek Energy Services data. The Northeast and Southeast regions, two of the largest consuming regions for power burn, registered week-over-week declines of 33.0% and 7.1%, respectively. This more than offset slight increases in power burn in Texas and the Southwest regions, where temperatures trended closer to normal and supported air conditioning load. Residential and commercial consumption increased 7.6% (though July is a month of minimal demand in these sectors), and industrial consumption increased 2.1%. U.S. pipeline exports to Mexico fell 3.5%.
Supply was flat over the report week. Dry production, which is the largest contributor to U.S. natural gas supply, decreased by 0.4%. Small levels of net U.S. exports to Canada from the Northeast drove the overall decline in total U.S. net imports from Canada, according to data from Bentek. Production this week was 2.8% greater than the year-ago level.
Storage
Working natural gas in storage increased to 2,845 Bcf as of Friday, July 26, according to EIA's WNGSR. The 59-Bcf gain in storage was greater than both the 28 Bcf injection that occurred during the same week in 2012 and the 5-year average increase of 47 Bcf. Current inventories remain 368 Bcf (11.5%) less than last year at this time and 34 Bcf (1.2%) below the 5-year average of 2,879 Bcf.
All three storage regions posted increases this week. Net injections in the East and West regions were higher than their 5-year average injections, growing by 44 Bcf and 6 Bcf respectively. The Producing region's net injection this week was 9 Bcf, compared with that region's 5-year average net withdrawal of 1 Bcf. In the Producing region, despite a decrease of 7 Bcf in salt cavern facilities, inventories in nonsalt cavern facilities grew by 17 Bcf.
The net injection was larger than market expectations, which on average were reported to be 56 Bcf. Natural gas prompt-month Nymex futures prices fell about $0.04 per MMBtu to just under $3.36 per MMBtu immediately following WNGSR's release. In trading during the hour following the release, prices rebounded and traded around $3.40 per MMBtu.
Moderate temperatures during the storage report week supported this week's greater-than-average net injection. Temperatures in the Lower 48 states were 1.1 degrees warmer than the 30-year normal temperature and 1.4 degrees cooler than during the same period last year, and averaged 76.6 degrees for the week, compared to 78.0 degrees last year and the 30-year normal of 75.4 degrees.
See also:
| Spot Prices ($/MMBtu) | Thu, 01-Aug |
Fri, 02-Aug |
Mon, 05-Aug |
Tue, 06-Aug |
Wed, 07-Aug |
|---|---|---|---|---|---|
| Henry Hub |
3.43 |
3.39 |
3.33 |
3.35 |
3.32 |
| New York |
3.38 |
3.22 |
3.33 |
3.38 |
3.42 |
| Chicago |
3.48 |
3.43 |
3.40 |
3.44 |
3.42 |
| Cal. Comp. Avg,* |
3.54 |
3.46 |
3.46 |
3.47 |
3.41 |
| Futures ($/MMBtu) | |||||
| September Contract |
3.387 |
3.347 |
3.319 |
3.318 |
3.247 |
| October Contract |
3.415 |
3.375 |
3.346 |
3.343 |
3.272 |
| *Avg. of NGI's reported prices for: Malin, PG&E citygate, and Southern California Border Avg. | |||||
| Source: NGI's Daily Gas Price Index | |||||
| U.S. Natural Gas Supply - Gas Week: (7/31/13 - 8/7/13) | ||
|---|---|---|
Percent change for week compared with: |
||
last year |
last week |
|
| Gross Production | 2.85%
|
-0.03%
|
| Dry Production | 2.82%
|
-0.03%
|
| Canadian Imports | -22.16%
|
-4.75%
|
| West (Net) | -1.11%
|
-0.70%
|
| MidWest (Net) | -12.47%
|
-4.45%
|
| Northeast (Net) | -112.62%
|
N/A
|
| LNG Imports | -45.68%
|
12.77%
|
| Total Supply | 0.25%
|
-0.32%
|
| Source: BENTEK Energy LLC | ||
| U.S. Consumption - Gas Week: (7/31/13 - 8/7/13) | ||
|---|---|---|
Percent change for week compared with: |
||
last year |
last week |
|
| U.S. Consumption | -10.45%
|
1.11%
|
| Power | -21.44%
|
5.62%
|
| Industrial | 0.82%
|
-0.40%
|
| Residential/Commercial | 8.00%
|
-6.82%
|
| Total Demand | -9.69%
|
1.04%
|
| Source: BENTEK Energy LLC | ||
| Rigs | |||
|---|---|---|---|
Fri, August 02, 2013 |
Change from |
||
last week |
last year |
||
| Oil Rigs | 1,388 |
-0.93% |
-2.87% |
| Natural Gas Rigs | 388 |
5.15% |
-22.09% |
| Miscellaneous | 6 |
0.00% |
100.00% |
| Rig Numbers by Type | |||
|---|---|---|---|
Fri, August 02, 2013 |
Change from |
||
last week |
last year |
||
| Vertical | 432 |
2.37% |
-21.02% |
| Horizontal | 1,073 |
0.56% |
-7.10% |
| Directional | 277 |
-3.48% |
21.49% |
| Source: Baker Hughes Inc. | |||
| Working Gas in Underground Storage | ||||
|---|---|---|---|---|
Stocks billion cubic feet (bcf) |
||||
| Region | 8/2/13
|
7/26/13
|
change |
|
| East | 1,408 |
1,350 |
58
|
|
| West | 484 |
461 |
23
|
|
| Producing | 1,049 |
1,034 |
15
|
|
| Total | 2,941 |
2,845 |
96
|
|
| Source: U.S. Energy Information Administration | ||||
| Working Gas in Underground Storage | |||||
|---|---|---|---|---|---|
Historical Comparisons |
|||||
Year ago (8/2/12) |
5-year average (2008-2012) |
||||
| Region | Stocks (Bcf) |
% change |
Stocks (Bcf) |
% change |
|
| East | 1,631 |
-13.7 |
1,513 |
-6.9 |
|
| West | 498 |
-2.8 |
435 |
11.3 |
|
| Producing | 1,109 |
-5.4 |
973 |
7.8 |
|
| Total | 3,238 |
-9.2 |
2,921 |
0.7 |
|
| Source: U.S. Energy Information Administration | |||||
| Temperature -- Heating & Cooling Degree Days (week ending Aug 01) | ||||||||
|---|---|---|---|---|---|---|---|---|
HDD deviation from: |
CDD deviation from: |
|||||||
| Region | HDD Current |
normal |
last year |
CDD Current |
normal |
last year |
||
| New England | 3
|
1
|
1
|
68
|
23
|
18
|
||
| Middle Atlantic | 2
|
0
|
1
|
78
|
19
|
8
|
||
| E N Central | 6
|
3
|
6
|
60
|
2
|
-29
|
||
| W N Central | 2
|
-1
|
2
|
67
|
-5
|
-48
|
||
| South Atlantic | 0
|
0
|
0
|
103
|
5
|
-6
|
||
| E S Central | 0
|
0
|
0
|
91
|
-4
|
-20
|
||
| W S Central | 0
|
0
|
0
|
125
|
-1
|
-17
|
||
| Mountain | 0
|
-3
|
0
|
88
|
8
|
-4
|
||
| Pacific | 0
|
-4
|
-2
|
61
|
16
|
10
|
||
| United States | 2
|
0
|
1
|
83
|
8
|
-9
|
||
|
Note: HDD = heating degree-day; CDD = cooling degree-day Source: National Oceanic and Atmospheric Administration | ||||||||
Average temperature (°F)
7-Day Mean ending Aug 01, 2013
Source: NOAA/National Weather Service
Deviation between average and normal (°F)
7-Day Mean ending Aug 01, 2013
Source: NOAA/National Weather Service