Winter Lookback
Fundamental natural gas market changes become apparent as winter temperatures return to 10-year average levels
The return of temperatures this past winter (November 2012 through March 2013) to levels close to average levels over the last 10 years marked a return to a more balanced U.S. natural gas market after the abnormally low demand associated with the extremely warm winter of 2011-12.
The changes to the natural gas market that became apparent included:
Slowly rising natural gas production: Domestic production in the winter of 2012-13 was slightly higher than during the winter of 2011-12. The increase (1.3 percent) was smaller than that of the previous two winters, both of which saw production rise by more than 7 percent. However, the fact that production has remained steady through this winter was noteworthy given the continuation of low natural gas prices.
A shift in natural gas consumption patterns: The combination of high winter natural gas consumption in the electric power sector and more typically seasonal levels of residential and commercial consumption resulted in total U.S. natural gas consumption in winter 2012-13 that was higher than the three previous winters. Production growth and price changes over this period allowed the electric power sector to increase its share of total consumption compared with the similarly seasonal winters of 2009-10 and 2010-11.
Relatively low natural gas prices: Henry Hub natural gas prices rose from the low they reached in early April 2012 over the remainder of 2012. Although this trend continued throughout the winter, prices remained below the levels of the winters of 2009-10 and 2010-11 for most regions of the United States. However, prices in New York and New England periodically spiked this winter to levels well above the national average in response to weather-driven pipeline constraints. These constraints and their impact on prices will be discussed in greater detail in a separate Northeast winter review piece.
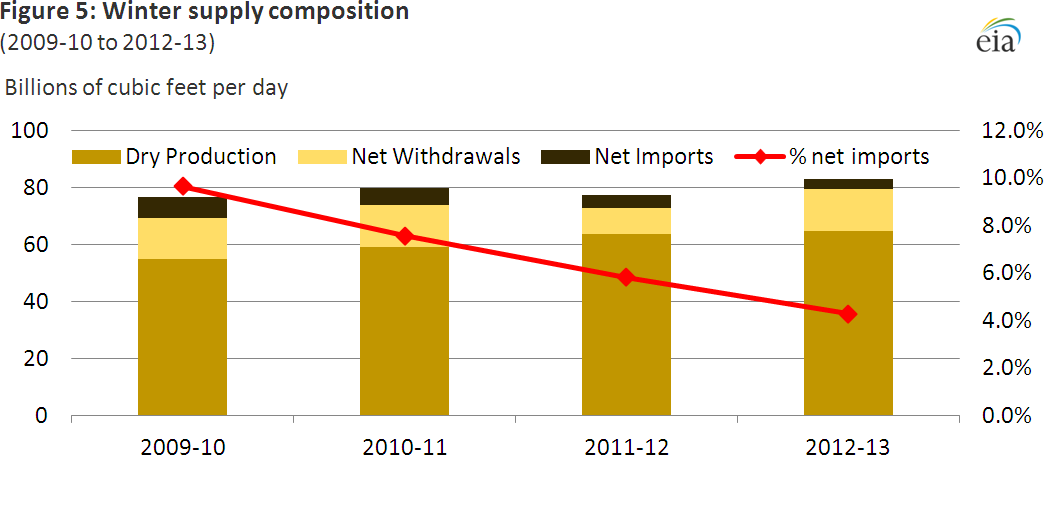
Natural gas imports fall: As domestic production has grown over the past several years, a declining portion of consumption is being met with net imports. The decline continued in winter 2012-13, including both lower net imports from Canada and lower liquefied natural gas (LNG) receipts.
Steadily increasing natural gas production
Average daily winter natural gas production rose 17 percent over the past three years, although the rate of growth in production has slowed over the past two years (Figure 1).
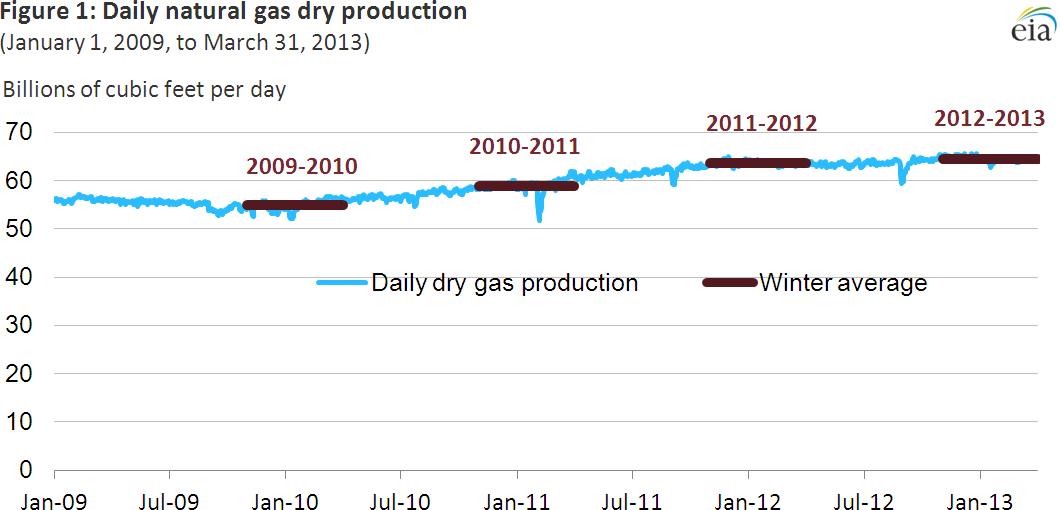
Source: U.S. Energy Information Administration based on Bentek Energy LLC data.
Daily dry natural gas production this past winter averaged 64.5 billion cubic feet per day (Bcf/d), a 1.3 percent increase over average production during winter 2011-12, according to data from Bentek Energy LLC. Much of the recent increase in production can be attributed to the adoption of more efficient drilling techniques and the continued targeting of liquids-rich shale gas formations. Increased production from the Pennsylvania portion of the Marcellus Shale Basin accounted for much of the overall increase.
A return to 10-year average temperatures
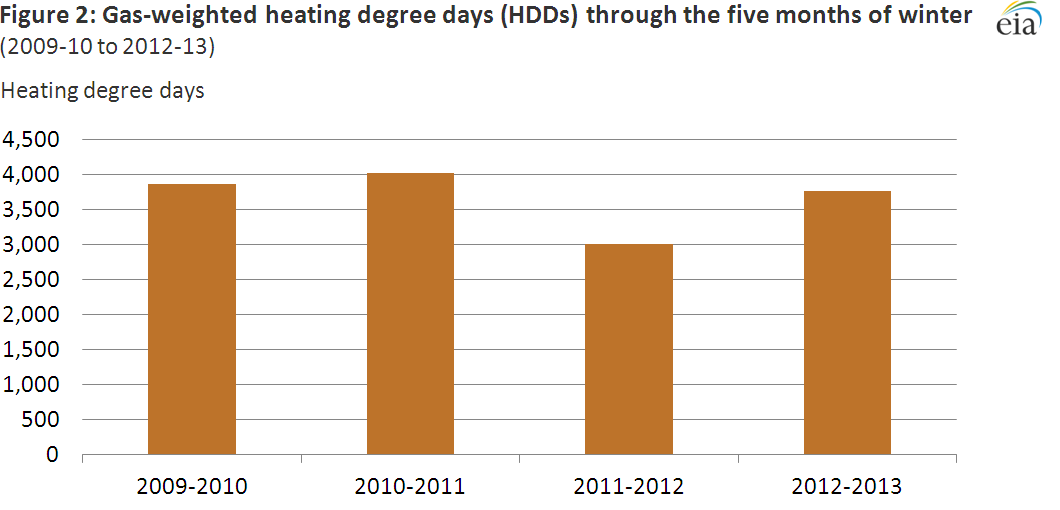
Source: National Oceanic and Atmospheric Administration (NOAA).
Weather plays an important role in winter natural gas markets because of increased demand from heating load. Cumulative monthly heating degree days (HDDs) from November 2012 through March 2013 were 1.2 percent more than the 10-year average, according to data from the National Oceanic and Atmospheric Administration (NOAA). This reflected a 26-percent increase over the record-low 2011-12 winter, which was 20 percent below the 10-year average. This past winter's weather was much closer to the winters of 2009-10 and 2010-11 (Figure 2).
Power generation uses more natural gas
The amount and percent of natural gas consumed for electric generation this winter decreased year-on-year, as residential and commercial consumption rebounded from year-ago low levels and prices rose, leading to reduced coal-to-gas switching from generators. However, despite declining below year-ago levels, natural gas consumed for electric generation this past winter remained above that of winters 2009-10 and 2010-11 as higher levels of domestic natural gas production and a low price environment made natural gas-fired generation more competitive with coal-fired generation than in those years.
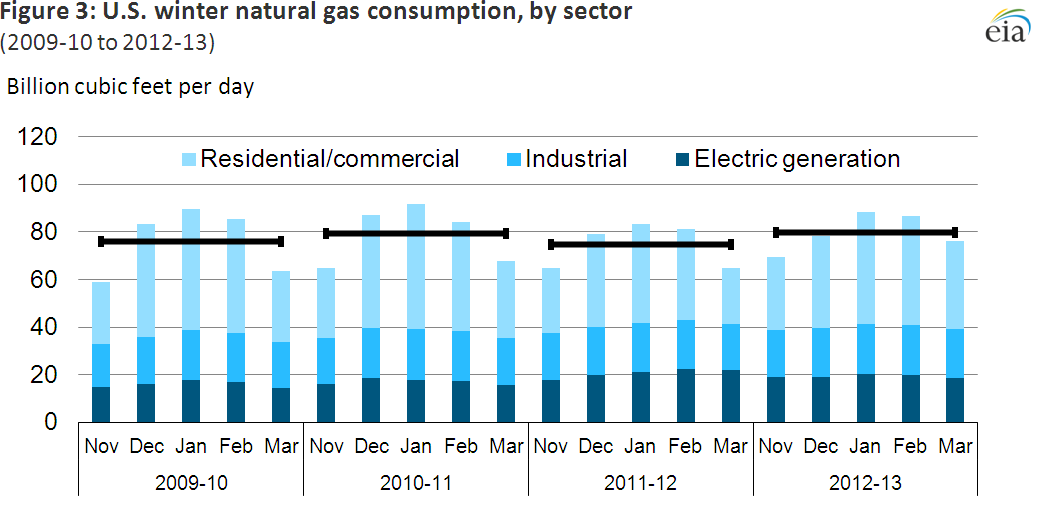
Source: U.S. Energy Information Administration based on Bentek Energy LLC data
Note: Horizontal bars represent average total natural gas consumption for the winter (November-March).
The amount of natural gas consumed by electric power generators declined 6.5 percent from year-ago levels to an average of 19.4 Bcf/d, but remained 13 percent above 2010-11 winter levels and 20 percent above the 2009-10 winter average, according to Bentek data. Residential and commercial natural gas consumption rose to 39.7 Bcf/d this winter, 16.7 percent above year-ago levels and only 1.4 and 4.3 percent below levels seen during the winters of 2009-10 and 2010-11, respectively.
The combination of high gas consumption by electric generators and more seasonal levels of residential and commercial consumption resulted in total U.S. natural gas demand this winter averaging 79.7 Bcf/d, higher than any of the previous three winters (Figure 3). Electric generation accounted for 24 percent of all natural gas demand, compared to 28 percent last winter, 21 percent during winter 2009-10, and 22 percent during winter 2010-11.
Lower natural gas prices
With more typical seasonal temperatures this winter, average wholesale spot prices rose year-on-year. The higher prices made natural gas somewhat less competitive with coal than in 2011-12, and led to decreased consumption for generation. However, higher overall levels of natural gas production meant that prices did not reach the levels of the winters of 2009-10 and 2010-11 (Figure 4), despite similar levels of HDDs.
By late March 2013, Henry Hub prices surpassed $4 per MMBtu, significantly higher than a year ago. This was largely as a result of a seasonally cold March, which caused a tighter supply-demand balance for natural gas. Natural gas storage levels on March 31, 2013 totaled 1,710 Bcf, 31 percent below year-ago inventories and just 5 percent above average March 31 storage levels for 2009-11.
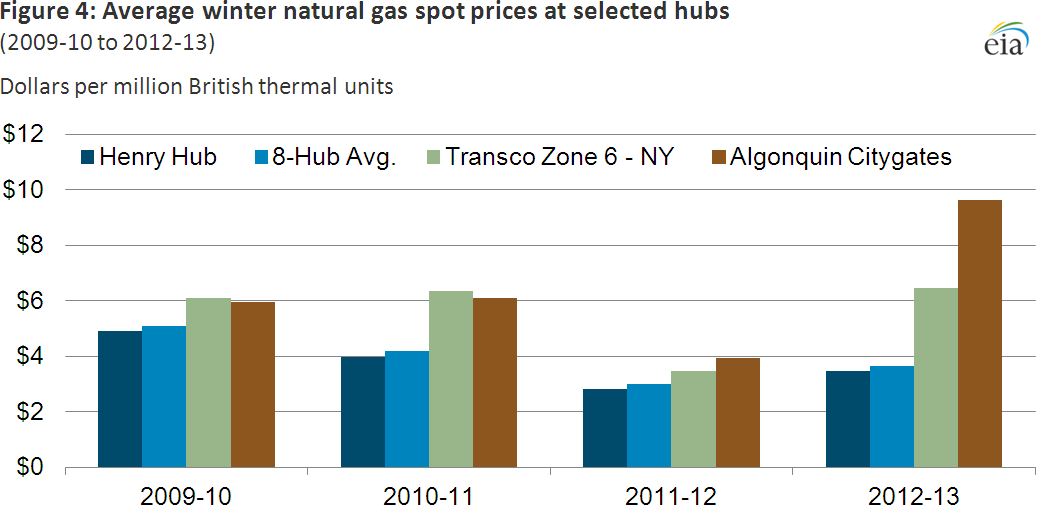
For the 2012-13 winter, the average Henry Hub spot price rose 22 percent over the winter 2011-12, reaching $3.46 per MMBtu, with the eight other major trading hubs following a similar pattern. However, the Henry Hub spot price remained 13 percent below the 2010-11 winter average, and 30 percent below the 2009-10 winter average, with prices at most trading points showing similar differences. Two notable exceptions were the Transco Zone 6-NY and the Algonquin Citygate price points, which serve the New York and New England areas, respectively. The average spot price at these two trading locations was greater than during any of the past three winters, largely due to northeastern pipeline constraints and changes in regional import patterns.
Lower natural gas imports
With higher domestic production, a declining portion of demand is being met with imports (Figure 5). The decline in net imports continued in the winter of 2012-13 and has been the result of both lower net imports from Canada and lower liquefied natural gas (LNG) imports. In addition, slightly greater amounts of natural gas have been exported to Mexico.
Source: U.S. Energy Information Administration based on Bentek Energy LLC data.