In the News continued — Natural Gas Year in Review:
High natural gas inventory last spring limited injections during the 2012 storage injection season
Working natural gas storage inventories entered the injection season on March 31, 2012 at 2,477 billion cubic feet (Bcf), following a winter that had a combination of high natural gas production and low heating degree days. This storage volume was the highest amount recorded for that date since the Natural Gas Monthly storage dataset began in 1976, and meant that only 1,762 Bcf of demonstrated peak storage capacity was available for additional injections, versus a five-year average of 2,354 Bcf. This limited the degree to which inventories could increase from April through October, the period when natural gas is traditionally stored in order to meet the next winter's heating needs. The market responded in several ways.
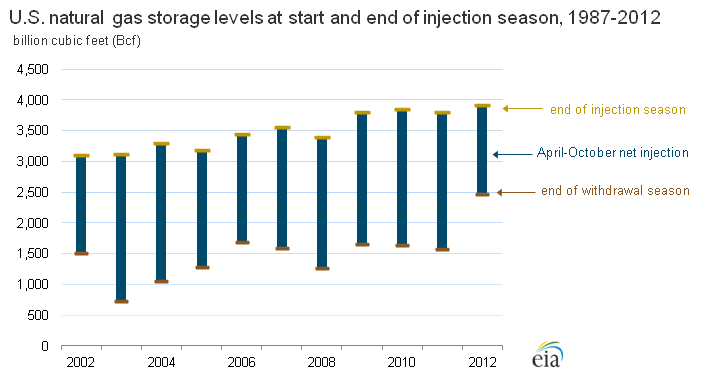
Source: U.S. Energy Information Administration, Natural Gas Monthly.
Note: Note: Based on monthly data for the Lower 48 states. End of withdrawal season represents data as of March 31; end of the injection season represents data as of October 31. Working gas storage capacity as of December 31 of the previous year.
Capacity Constraint
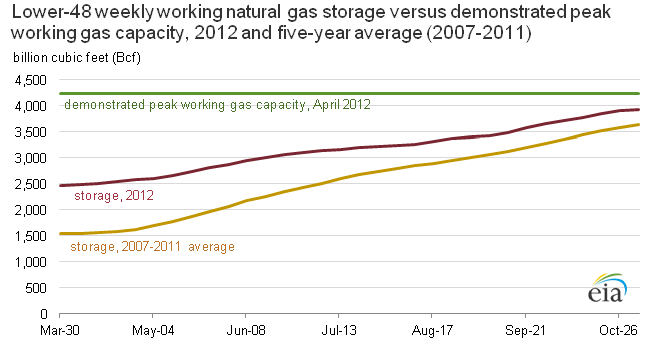
Source: U.S. Energy Information Administration, Weekly Natural Gas Storage Report and Peak Underground Working Natural Gas Storage Capacity.
Note: Data is weekly, for the Lower 48 states. Historical maximum data estimated based off interpolation from historical Weekly Natural Gas Storage Report Data.
Because of significant capacity constraints on how much gas could be injected during April-October 2012, Lower 48 working natural gas inventories rose by only 1,453 Bcf from March 31, 2012, through October 31, 2012. This compares with a five-year average increase between these dates for 2007-11 of 2,134 Bcf, as shown above. The net injection in 2012 was the lowest net injection from April 1 through October 31 since 1987, according to EIA's Natural Gas Monthly report. If the 2007-11 5-year average injections had occurred during 2012, working natural gas in storage would have risen to 4,611 Bcf by October 31, surpassing the demonstrated peak working gas storage capacity by 372 Bcf, according to data from the EIA Peak Underground Working Natural Gas Storage Capacity report. This meant that net storage injections during April-October 2012 had to decrease, through some combination of increased consumption, decreased net imports, or decreased production. As discussed below, increased consumption was the main avenue for balancing the market.
Market Response – Price
As inventories climbed to a record 777 Bcf above their historical maximum levels through the end of March, prices declined through the middle of April, bottoming out at $1.86 per million British thermal units (MMBtu) in mid-April, according to data from the Natural Gas Weekly Update. Price levels gradually increased through the April-October 2012 injection season as the supply overhang slowly decreased. They reached $3.40 per MMBtu by the end of October, higher than in the spring but still well below levels in 2011.
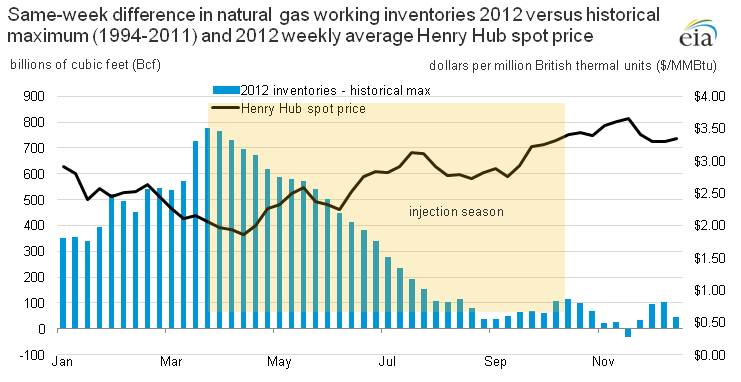
Source: U.S. Energy Information Administration, Weekly Natural Gas Storage Report, Natural Gas Weekly Update
Note: Data is weekly, for the Lower 48 states. Historical maximum data estimated based off interpolation from historical Weekly Natural Gas Storage Report Data.
Market Response – Supply and Disposition
During the injection season of 2012, net injections decreased to 6.8 billion cubic feet per day (Bcf/d), 35% below the average daily injection for April-October 2011. That meant there was an extra 3.6 Bcf/d that needed to be offset by decreased supply or increased consumption. As it turned out, natural gas consumption for electric generation increased enough to make up the difference.
Supply. Overall, natural gas supplies rose during the 2012 injection season, as compared with 2011. Production during that period averaged 69.1 Bcf/d in 2012, as compared with 66.1 Bcf/d in 2011. Net imports declined, but by a much smaller amount than production increased (see graph below).
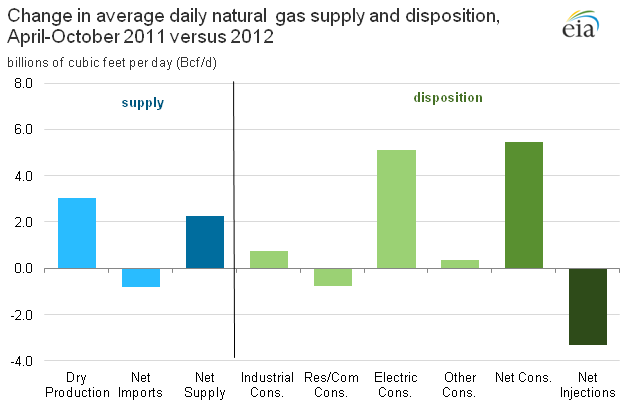
Source: U.S. Energy Information Administration, Natural Gas Monthly.
Note: "Cons." equals consumption.
Disposition. Natural gas consumption increased substantially during the 2012 injection season compared with 2011, primarily for electric power generation. Natural gas consumed for electric generation rose by 5 Bcf/d, to 28 Bcf/d from 23.0 Bcf/d in 2011, according to Natural Gas Monthly data. Industrial consumption also increased slightly.
‹ back to Natural Gas Weekly Update