2012 Brief: Average wholesale natural gas prices fell 31% in 2012
This article continues a series of briefs on energy market trends in 2012.
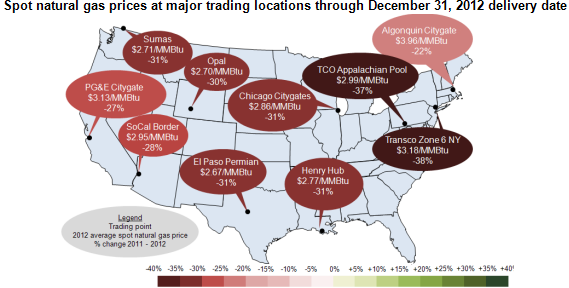
Average wholesale (spot) prices for natural gas fell significantly throughout the United States in 2012 compared to 2011. The average wholesale price for natural gas at Henry Hub in Erath, Louisiana, a key benchmark location for pricing throughout the United States, fell from an average $4.02 per million British thermal units (MMBtu) in 2011 to $2.77 per MMBtu in 2012. This was the lowest average annual price at Henry Hub since 1999.
A mild 2011-12 winter, sustained high natural gas inventories, and rising natural gas production in the Marcellus and Eagle Ford basins contributed to lower average spot natural gas prices at Henry Hub. Average spot natural gas prices at Henry Hub fell despite rising natural gas use for power generation, lower overall natural gas net imports from Canada by pipeline, reduced liquefied natural gas imports, higher natural gas exports to Mexico, and temporary production shut-ins related to Hurricane Isaac. Total natural gas production was higher in 2012 than in 2011; however, in contrast to 2011, when production grew steadily over the course of the year, 2012 saw production generally remain flat, close to the level reached towards the end of 2011.
The decline in average wholesale natural gas prices was roughly uniform throughout the United States. Most trading points averaged within plus or minus $0.25 per MMBtu of Henry Hub. Average annual prices for natural gas fell 30%-34% at 5 of 10 major trading points in 2012 compared to 2011. An increased supply of natural gas significantly contributed to higher inventories and lower prices nationwide. Total dry natural gas production for the Lower 48 states rose to an average of 63.6 billion cubic feet per day (Bcf/d) in 2012, an increase of almost 4%, or 2.6 Bcf/d, over 2011, versus a rise in consumption of about 3%, or 2.2 Bcf/d, according to data from Bentek Energy LLC. Much of this increase can be attributed to increased production from the Pennsylvania portion of the Marcellus Shale Basin, as well as the adoption of more efficient drilling techniques and the continued targeting of liquids-rich shale gas formations.
The largest annual average price decrease was 38% at the Transco Zone 6 NY hub, which serves the New York City metropolitan area. The average price at Transco Zone 6 NY fell to $3.18 per MMBtu in 2012, down from an average of $5.15 per MMBtu in 2011. The smallest annual price decrease was 22% at the Algonquin Citygate hub, which serves New England, to $3.96 per MMBtu, down from $5.10 per MMBtu in 2011.
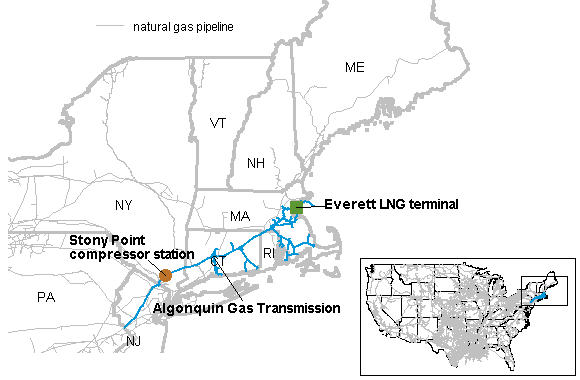
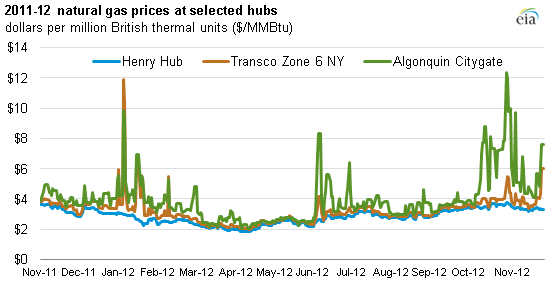
These two Northeast trading points reflected average wholesale prices that were well above the price for Henry Hub because of northeastern pipeline constraints. The price effect of constraints was greatest during peak periods—during colder winter and warmer summer months—as shown below. Beginning in February 2012, the spread between the spot price at the Algonquin Citygate and Henry Hub regularly surpassed the spread between Transco Zone 6 NY and Henry Hub during these peak demand periods. Historically, natural gas at the Transco 6 NY trading point was priced higher than natural gas at the Algonquin Citygate trading point.
During 2012, the spread between natural gas priced at Henry Hub versus the Algonquin Cityage remained relatively high while the spread between natural gas priced at Henry Hub and Transco Zone 6 NY went down. This is mainly because of pipeline capacity expansions in the Northeast that improved deliverability to the Mid-Atlantic market, including New York City. Falling Eastern Canadian natural gas production coupled with reduced LNG deliveries into New England have also contributed to the Algonquin Citygate's higher prices.
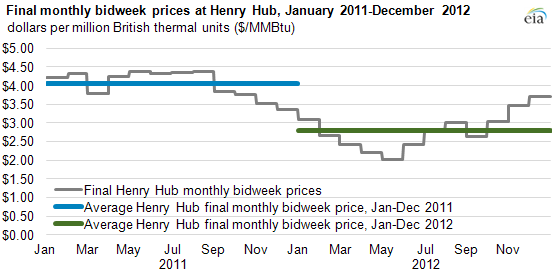
Natural gas prices fell from August 2011 to May 2012, from $4.37 per MMBtu to $2.03 per MMBtu. Prices recovered from June 2012 through the end of the year, but remained lower than levels seen through most of 2011. As a result, the average Henry Hub monthly bidweek price for 2012 was $2.78 per MMBtu, 31% below the year-ago average.
After reaching their low point in May 2012, natural gas prices rose slightly during summer months as production leveled off in response to lower prices and relatively hot weather contributed to an increase in natural gas use for power generation. As demand and prices gradually rose during the April-October natural gas storage injection season, the buildup in inventories continued but at a slower pace. Net imports from Canada continued to fall because of decreasing gross imports and increasing gross exports.