Today in Energy
Recent Today in Energy analysis of natural gas markets is available on the EIA website.
Market Highlights:
(For the week ending Wednesday, January 14, 2026)Prices
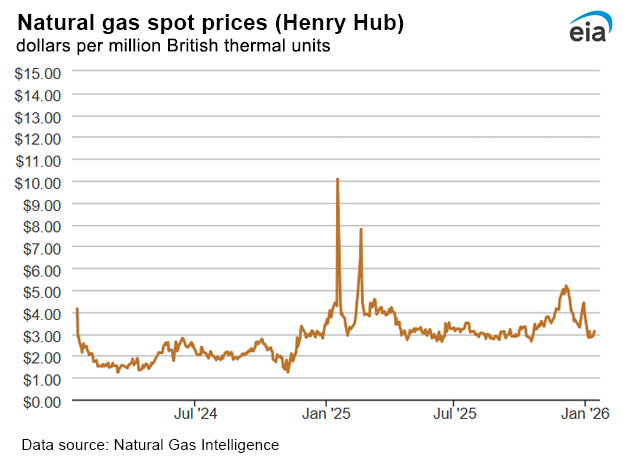
- Henry Hub spot price: The Henry Hub spot price rose 1 cent from $3.11 per million British thermal units (MMBtu) last Wednesday to $3.12/MMBtu yesterday.
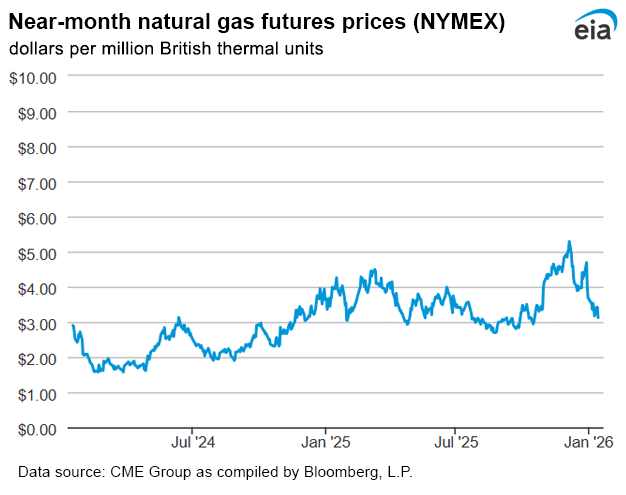
- Henry Hub futures price: The price of the February 2026 NYMEX contract decreased 41 cents, from $3.525/MMBtu last Wednesday to $3.120/MMBtu yesterday. That price marks the lowest value for the February 2026 contract since mid-2020. The price of the 12-month strip averaging February 2026 through January 2027 futures contracts also declined, down 21 cents to $3.324/MMBtu.
- Select regional spot prices: Natural gas spot prices were mixed at most locations this report week (Wednesday, January 7, to Wednesday, January 14). Price changes ranged from a decrease of 59 cents at SoCal Border – Ehrenberg to an increase of $5.55/MMBtu at the Algonquin Citygate.
- Spot prices on the West Coast fell at most trading locations this report week, partly because high seasonal hydroelectric generation displaced natural gas-fired power generation. The price at PG&E Citygate in Northern California fell 37 cents from $2.55/MMBtu last Wednesday to $2.18/MMBtu yesterday. The day prior closed at $2.16/MMBtu, marking the lowest real price in January since at least 1999, according to Natural Gas Intelligence. At Northwest Sumas on the Canada-Washington state border, a key pricing point for natural gas in the Pacific Northwest, the price decreased 56 cents from $2.28/MMBtu last Tuesday to $1.72/MMBtu yesterday. This hub also reported a price of $1.65/MMBtu on Monday, the lowest real price recorded in January going back to at least 1999. Over the past week, natural gas supplied an average of 18% of electricity generation to the Pacific Northwest, compared with 42% from hydroelectric power, according to EIA’s Hourly Electric Grid Monitor. Over the same week in the previous three years, hydroelectric generation averaged 30%, with natural gas at 22% of generation. In general, weekly natural gas usage for electrical power was flat this week at 1.4 billion cubic feet (Bcf) in the Pacific Northwest, according to LSEG Data, tempering upward price momentum throughout the region. Natural gas prices further south at SoCal Citygate also fell 56 cents, from $3.39/MMBtu last Wednesday to $2.83/MMBtu yesterday. Average temperatures in the Western region were flat from last week at 45°F, with only an additional 52 heating degree days (HDDs) compared to last week, or 1 more than normal for this time of year.
- International futures prices: International natural gas futures price changes were mixed this report week. According to Bloomberg Finance, L.P., weekly average front-month futures prices for liquefied natural gas (LNG) cargoes in East Asia decreased 2 cents to a weekly average of $9.59/MMBtu. Natural gas futures for delivery at the Title Transfer Facility (TTF) in the Netherlands increased 50 cents to a weekly average of $10.22/MMBtu. In the same week last year (week ending January 15, 2025), the prices were $14.15/MMBtu in East Asia and $14.00/MMBtu at TTF. Higher prices at TTF reflect colder temperatures in Europe and decreasing natural gas storage inventories. Top
Daily spot prices by region are available on the EIA website.
Liquefied Natural Gas (LNG)
- Vessels departing U.S. ports: Thirty-three LNG vessels with a combined LNG-carrying capacity of 127 Bcf departed U.S. ports between January 8 and January 15, according to data from Bloomberg Finance, L.P.:
- Eight tankers from Sabine Pass
- Seven from Plaquemines
- Five each from Cameron, Corpus Christi, and Freeport
- Two from Calcasieu Pass
- One from Cove Point
Rig Count
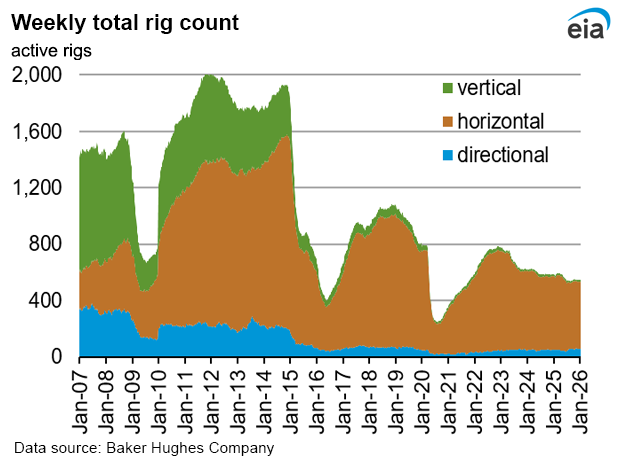
- According to Baker Hughes, for the week ending Tuesday, January 6, the natural gas rig count decreased by 1 rig from a week ago to 124 rigs. The Haynesville dropped one rig. The number of oil-directed rigs decreased by 3 rigs from a week ago to 409 rigs. The Permian dropped three rigs, and the Mississippian and the Williston each dropped one rig. The Granite Wash added one rig, and one rig was added among unidentified producing regions. The total rig count, which includes 11 miscellaneous rigs, now stands at 544 rigs, 40 fewer than at this time last year.
Storage
- Net withdrawals from storage totaled 71 Bcf for the week ending January 9, compared with the five-year (2021–25) average net withdrawals of 146 Bcf and last year's net withdrawals of 227 Bcf during the same week. Working natural gas stocks totaled 3,185 Bcf, which is 106 Bcf (3%) more than the five-year average and 33 Bcf (1%) more than last year at this time.
- The average rate of withdrawals from storage is 8% higher than the five-year average so far in the withdrawal season (November through March). If the rate of withdrawals from storage matched the five-year average of 15.6 Bcf/d for the remainder of the withdrawal season, the total inventory would be 1,924 Bcf on March 31, which is 106 Bcf higher than the five-year average of 1,818 Bcf for that time of year.
See also:
Top
| Spot Prices ($/MMBtu) | Thu, 08-Jan |
Fri, 09-Jan |
Mon, 12-Jan |
Tue, 13-Jan |
Wed, 14-Jan |
|---|---|---|---|---|---|
| Henry Hub |
2.87 |
2.84 |
2.90 |
3.04 |
3.12 |
| New York |
2.51 |
2.76 |
2.75 |
2.98 |
7.00 |
| Chicago |
2.59 |
2.63 |
2.59 |
2.85 |
2.80 |
| Cal. Comp. Avg.* |
2.35 |
2.09 |
2.01 |
1.98 |
1.96 |
| *Avg. of NGI's reported prices for: Malin, PG&E Citygate, and Southern California Border Avg. | |||||
| Data source: NGI's Daily Gas Price Index | |||||
| Rigs | |||
|---|---|---|---|
Tue, January 06, 2026 |
Change from |
||
|
last week
|
last year
|
||
| Oil rigs |
409
|
-0.7%
|
-14.8%
|
| Natural gas rigs |
124
|
-0.8%
|
24.0%
|
| Note: Excludes any miscellaneous rigs | |||
| Rig numbers by type | |||
|---|---|---|---|
Tue, January 06, 2026 |
Change from |
||
|
last week
|
last year
|
||
| Vertical |
12
|
-14.3%
|
-7.7%
|
| Horizontal |
475
|
-0.2%
|
-9.0%
|
| Directional |
57
|
1.8%
|
16.3%
|
| Data source: Baker Hughes Company |
|||
| Working gas in underground storage | ||||
|---|---|---|---|---|
Stocks billion cubic feet (Bcf) |
||||
| Region |
2026-01-09 |
2026-01-02 |
change |
|
| East |
664 |
697 |
-33 |
|
| Midwest |
790 |
821 |
-31 |
|
| Mountain |
251 |
256 |
-5 |
|
| Pacific |
302 |
304 |
-2 |
|
| South Central |
1,178 |
1,178 |
0 |
|
| Total |
3,185 |
3,256 |
-71 |
|
|
Data source: U.S. Energy Information Administration Form EIA-912, Weekly Underground Natural Gas Storage Report Note: Totals may not equal sum of components because of independent rounding. | ||||
| Working gas in underground storage | |||||
|---|---|---|---|---|---|
Historical comparisons |
|||||
Year ago 1/9/25 |
5-year average 2021-2025 |
||||
| Region | Stocks (Bcf) |
% change |
Stocks (Bcf) |
% change |
|
| East |
679 |
-2.2 |
705 |
-5.8 |
|
| Midwest |
818 |
-3.4 |
842 |
-6.2 |
|
| Mountain |
242 |
3.7 |
190 |
32.1 |
|
| Pacific |
284 |
6.3 |
238 |
26.9 |
|
| South Central | 1,127 |
4.5 |
1,104 |
6.7 |
|
| Total | 3,152 |
1.0 |
3,079 |
3.4 |
|
| Data source: U.S. Energy Information Administration Form EIA-912, Weekly Underground Natural Gas Storage Report
Note: Totals may not equal sum of components because of independent rounding. |
|||||
| Temperature – heating & cooling degree days (week ending Jan 08) | ||||||||
|---|---|---|---|---|---|---|---|---|
HDDs |
CDDs |
|||||||
| Region | Current total |
Deviation from normal |
Deviation from last year |
Current total |
Deviation from normal |
Deviation from last year |
||
| New England | 277 |
8 |
10 |
0 |
0 |
0 |
||
| Middle Atlantic | 244 |
-12 |
-23 |
0 |
0 |
0 |
||
| E N Central | 236 |
-56 |
-69 |
0 |
0 |
0 |
||
| W N Central | 225 |
-91 |
-120 |
0 |
0 |
0 |
||
| South Atlantic | 138 |
-43 |
-75 |
6 |
-1 |
5 |
||
| E S Central | 118 |
-70 |
-97 |
0 |
-2 |
0 |
||
| W S Central | 54 |
-86 |
-96 |
10 |
7 |
8 |
||
| Mountain | 170 |
-66 |
-51 |
0 |
0 |
0 |
||
| Pacific | 112 |
-13 |
13 |
0 |
0 |
0 |
||
| United States | 178 |
-46 |
-53 |
2 |
0 |
2 |
||
|
Data source: National Oceanic and Atmospheric Administration Note: HDDs=heating degree days; CDDs=cooling degree days | ||||||||
Average temperature (°F)
7-day mean ending Jan 08, 2026
Data source: National Oceanic and Atmospheric Administration
Deviation between average and normal temperature (°F)
7-day mean ending Jan 08, 2026
Data source: National Oceanic and Atmospheric Administration
Monthly U.S. dry shale natural gas production by formation is available in the
Short-Term Energy Outlook.