Today in Energy
Recent Today in Energy analysis of natural gas markets is available on the EIA website.
Market Highlights:
(For the week ending Wednesday, January 7, 2026)Prices
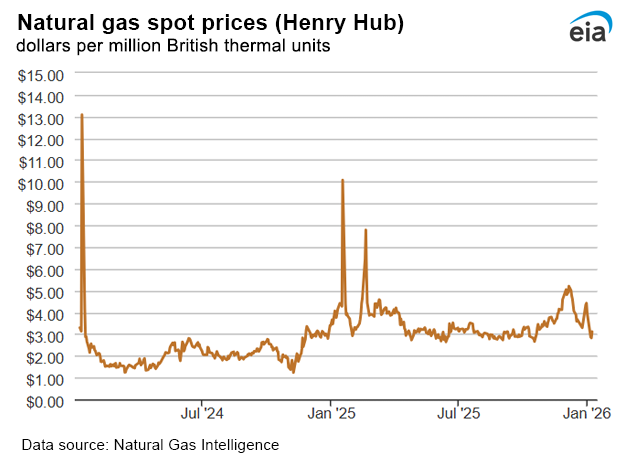
- Henry Hub spot price: The Henry Hub spot price fell 85 cents from $3.96 per million British thermal units (MMBtu) last Wednesday to $3.11/MMBtu yesterday, up from a low of $2.82/MMBtu on Tuesday, the lowest price since October 17. Yesterday’s Henry Hub spot price is down $2.08 from this season’s high of $5.19/MMBtu on December 5, 2025.
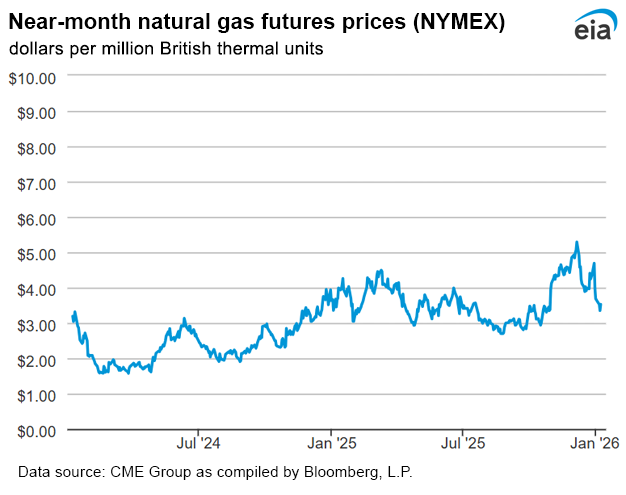
- Henry Hub futures price: The January 2026 NYMEX contract expired December 29 at $4.687/MMBtu, up 45 cents from Wednesday, December 24. The price of the February 2026 NYMEX contract decreased 16 cents, from $3.686/MMBtu last Wednesday to $3.525/MMBtu yesterday. The price of the 12-month strip averaging February 2026 through January 2027 futures contracts declined 19 cents to $3.536/MMBtu.
- Select regional spot prices: Natural gas spot prices fell at most locations this report week (Wednesday, December 31 to Wednesday, January 7). Price changes ranged from a decrease of $12.81 at the Algonquin Citygate to an increase of 11 cents at the Houston Ship Channel.
- Prices fell in the Northeast this report week as temperatures approached normal levels by the end of the report week. Prices decreased the most at the Algonquin Citygate, which serves the Boston area; the price fell from $18.76/MMBtu last Wednesday to $5.95/MMBtu yesterday. Historically, this hub has some of North America's highest natural gas spot prices in winter due to regional pipeline capacity constraints to meet New England's combined space heating and electricity demands. Enbridge reported capacity constraints this week for the Algonquin Gas Transmission pipeline, issuing an operational flow order effective on January 1 until further notice amid high utilization on Algonquin's network. Temperatures in the Boston area averaged 27°F this report week compared to an average of 28°F last report week, which resulted in 267 heating degree days (HDDs), 8 more than the previous report week. Moderating temperatures, going from a low of 22°F on January 5 to 35°F yesterday, contributed to much lower week over week prices. The Transco Zone 6 NY trading point for New York City also reported week over week price declines, decreasing $4.05 from $6.75/MMBtu last Wednesday to $2.70/MMBtu yesterday. Total natural gas consumption in the Northeast averaged more than 20.0 billion cubic feet per day [Bcf/d] each day from Thursday through Monday and fell to 16.9 Bcf/d yesterday, according to LSEG Data.
- International futures prices: International natural gas futures price changes were mixed this report week. According to Bloomberg Finance, L.P., weekly average front-month futures prices for liquefied natural gas (LNG) cargoes in East Asia decreased 4 cents to a weekly average of $9.61/MMBtu. Natural gas futures for delivery at the Title Transfer Facility (TTF) in the Netherlands increased 2 cents to a weekly average of $9.72/MMBtu. In the same week last year (week ending January 8, 2025), the prices were $14.30/MMBtu in East Asia and $14.55/MMBtu at TTF. Top
Daily spot prices by region are available on the EIA website.
Liquefied Natural Gas (LNG)
- Vessels departing U.S. ports: Thirty-eight LNG vessels with a combined LNG-carrying capacity of 143 billion cubic feet (Bcf) departed the United States between January 1 and January 7, according to shipping data provided by Bloomberg Finance, L.P.:
- Eleven tankers from Sabine Pass
- Seven from Plaquemines
- Six from Corpus Christi
- Five from Freeport
- Four from Cameron
- Three from Calcasieu Pass
- One each from Cove Point and Elba Island
Rig Count
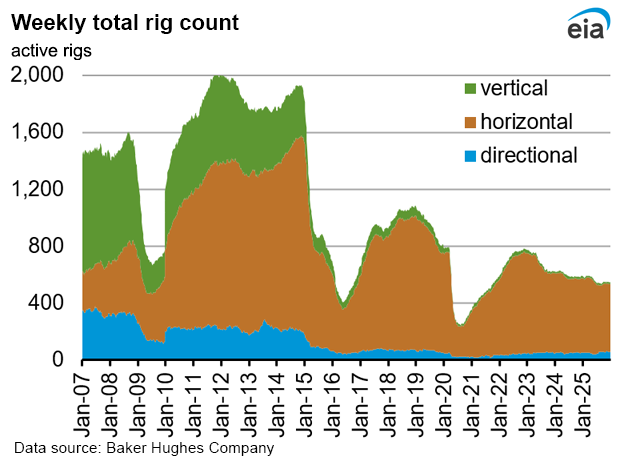
- According to Baker Hughes, for the week ending Tuesday, December 30, the natural gas rig count decreased by 2 rigs from a week ago to 125 rigs. The Eagle Ford dropped one rig, and one rig was dropped among unidentified producing regions. The number of oil-directed rigs increased by 3 rigs from a week ago to 412 rigs. Three rigs were added among unidentified producing regions. The total rig count, which includes 9 miscellaneous rigs, now stands at 546 rigs, 43 fewer than at this time last year.
Storage
- Net withdrawals from storage totaled 119 Bcf for the week ending January 2, compared with the five-year (2021–25) average net withdrawals of 92 Bcf and last year's net withdrawals of 51 Bcf during the same week. Working natural gas stocks totaled 3,256 Bcf, which is 31 Bcf (1%) more than the five-year average and 123 Bcf (4%) lower than last year at this time. Stocks in the East and Midwest regions are 6%–8% below the five-year average.
- The average rate of withdrawals from storage is 25% higher than the five-year average so far in the withdrawal season (November through March). If the rate of withdrawals from storage matched the five-year average of 16.0 Bcf/d for the remainder of the withdrawal season, the total inventory would be 1,849 Bcf on March 31, which is 31 Bcf higher than the five-year average of 1,818 Bcf for that time of year.
See also:
Top
| Spot Prices ($/MMBtu) | Thu, 01-Jan |
Fri, 02-Jan |
Mon, 05-Jan |
Tue, 06-Jan |
Wed, 07-Jan |
|---|---|---|---|---|---|
| Henry Hub | Holiday | Holiday | 2.86 | 2.82 | 3.11 |
| New York | Holiday | Holiday | 2.70 | 2.71 | 2.70 |
| Chicago | Holiday | Holiday | 2.59 | 2.57 | 2.70 |
| Cal. Comp. Avg,* | Holiday | Holiday | 2.18 | 2.20 | 2.43 |
| *Avg. of NGI's reported prices for: Malin, PG&E Citygate, and Southern California Border Avg. | |||||
| Source: NGI's Daily Gas Price Index | |||||
| Spot Prices ($/MMBtu) | Thu, 25-Dec |
Fri, 26-Dec |
Mon, 29-Dec |
Tue, 30-Dec |
Wed, 31-Dec |
|---|---|---|---|---|---|
| Henry Hub | Holiday | Holiday | 4.35 | 4.42 | 3.96 |
| New York | Holiday | Holiday | 7.54 | 5.13 | 6.75 |
| Chicago | Holiday | Holiday | 3.91 | 3.74 | 3.36 |
| Cal. Comp. Avg,* | Holiday | Holiday | 2.68 | 2.90 | 2.72 |
| *Avg. of NGI's reported prices for: Malin, PG&E Citygate, and Southern California Border Avg. | |||||
| Source: NGI's Daily Gas Price Index | |||||
| Spot Prices ($/MMBtu) | Thu, 18-Dec |
Fri, 19-Dec |
Mon, 22-Decn |
Tue, 23-Dec |
Wed, 24-Dec |
|---|---|---|---|---|---|
| Henry Hub | 3.86 | 3.58 | 3.68 | 3.35 | 3.29 |
| New York | 4.30 | 3.95 | 3.20 | 3.13 | 4.44 |
| Chicago | 3.51 | 3.19 | 2.95 | 2.75 | 3.07 |
| Cal. Comp. Avg,* | 2.71 | 2.49 | 2.42 | 2.20 | 2.29 |
| *Avg. of NGI's reported prices for: Malin, PG&E Citygate, and Southern California Border Avg. | |||||
| Source: NGI's Daily Gas Price Index | |||||
| Rigs | |||
|---|---|---|---|
Tue, December 30, 2025 |
Change from |
||
|
last week
|
last year
|
||
| Oil rigs |
412
|
0.7%
|
-14.5%
|
| Natural gas rigs |
125
|
-1.6%
|
21.4%
|
| Note: Excludes any miscellaneous rigs | |||
| Rig numbers by type | |||
|---|---|---|---|
Tue, December 30, 2025 |
Change from |
||
|
last week
|
last year
|
||
| Vertical |
14
|
-6.7%
|
7.7%
|
| Horizontal |
476
|
0.4%
|
-9.7%
|
| Directional |
56
|
0.0%
|
14.3%
|
| Data source: Baker Hughes Company |
|||
| Working gas in underground storage | ||||
|---|---|---|---|---|
Stocks billion cubic feet (Bcf) |
||||
| Region |
2026-01-02 |
2025-12-26 |
change |
|
| East |
697 |
736 |
-39 |
|
| Midwest |
821 |
865 |
-44 |
|
| Mountain |
256 |
264 |
-8 |
|
| Pacific |
304 |
307 |
-3 |
|
| South Central |
1,178 |
1,203 |
-25 |
|
| Total |
3,256 |
3,375 |
-119 |
|
|
Data source: U.S. Energy Information Administration Form EIA-912, Weekly Underground Natural Gas Storage Report Note: Totals may not equal sum of components because of independent rounding. | ||||
| Working gas in underground storage | |||||
|---|---|---|---|---|---|
Historical comparisons |
|||||
Year ago 1/2/25 |
5-year average 2021-2025 |
||||
| Region | Stocks (Bcf) |
% change |
Stocks (Bcf) |
% change |
|
| East |
738 |
-5.6 |
745 |
-6.4 |
|
| Midwest |
886 |
-7.3 |
891 |
-7.9 |
|
| Mountain |
256 |
0.0 |
200 |
28.0 |
|
| Pacific |
293 |
3.8 |
246 |
23.6 |
|
| South Central | 1,206 |
-2.3 |
1,144 |
3.0 |
|
| Total | 3,379 |
-3.6 |
3,225 |
1.0 |
|
| Data source: U.S. Energy Information Administration Form EIA-912, Weekly Underground Natural Gas Storage Report
Note: Totals may not equal sum of components because of independent rounding. |
|||||
| Temperature – heating & cooling degree days (week ending Jan 01) | ||||||||
|---|---|---|---|---|---|---|---|---|
HDDs |
CDDs |
|||||||
| Region | Current total |
Deviation from normal |
Deviation from last year |
Current total |
Deviation from normal |
Deviation from last year |
||
| New England | 290 |
29 |
87 |
0 |
0 |
0 |
||
| Middle Atlantic | 262 |
13 |
81 |
0 |
0 |
0 |
||
| E N Central | 240 |
-43 |
68 |
0 |
0 |
0 |
||
| W N Central | 239 |
-69 |
39 |
0 |
0 |
0 |
||
| South Atlantic | 147 |
-29 |
31 |
5 |
-2 |
-6 |
||
| E S Central | 126 |
-57 |
30 |
1 |
0 |
1 |
||
| W S Central | 82 |
-55 |
15 |
15 |
13 |
8 |
||
| Mountain | 189 |
-47 |
-8 |
0 |
0 |
0 |
||
| Pacific | 113 |
-13 |
5 |
0 |
0 |
0 |
||
| United States | 189 |
-30 |
41 |
3 |
2 |
0 |
||
|
Data source: National Oceanic and Atmospheric Administration Note: HDDs=heating degree days; CDDs=cooling degree days | ||||||||
Average temperature (°F)
7-day mean ending Jan 01, 2026
Data source: National Oceanic and Atmospheric Administration
Deviation between average and normal temperature (°F)
7-day mean ending Jan 01, 2026
Data source: National Oceanic and Atmospheric Administration
Monthly U.S. dry shale natural gas production by formation is available in the
Short-Term Energy Outlook.