Oil and Natural Gas Production
Oil and Natural Gas Reserves
At the end of 2008, the U.S. Securities and Exchange Commission (SEC) adopted a rule that made substantial changes in the ways oil (crude oil and natural gas liquids) and natural gas reserves are accounted for in the financial reporting subject to its jurisdiction. For most companies, and all FRS companies, this rule took effect when they reported their 2009 financial results. Briefly, the rule, "Modernization of Oil and Gas Reserve Reporting," has four major stipulations. 3 One changed the specification of the price of oil or natural gas that is used to determine whether oil and natural gas resources can be included in proved reserves. Previously, the price specified was the price on the last day of the previous year. The new rule uses an average of monthly prices over the time period covered by the financial report. Another change is the inclusion of nontraditional resources in oil and gas reserves. Companies will be able to include previously excluded resources such as "saleable hydrocarbons, in the solid, liquid, or gaseous state, from oil sands, shale, coalbeds, or other nonrenewable natural resources which are intended to be upgraded into synthetic oil or gas." 4 Another change redefines "reliable technology" 5 to broaden the types of technologies that a company may use to estimate reserves. And finally, in addition to proved reserves, companies may now disclose probable and/or possible reserves.
Proved reserves of oil and natural gas held by the Financial Reporting System (FRS) companies rose for both oil and natural gas in 2009, with oil reserves increasing at almost twice the rate of natural gas (Table 5). By far the largest increase in oil reserves occurred in Canada, with oil reserves falling in all other FRS regions, most notable the Former Soviet Union, except the U.S. Onshore and Offshore. 6 The massive increase of more than 4 billion barrels in Canada is largely due to the SEC rule change that allowed for the inclusion of reserves of oil sands for the first time in 2009; Canada has an abundant endowment of this type of reserves. For the FRS companies in total, 2.7 billion barrels of their increased oil reserves came from the addition of oil sands in Canada. Oil reserve additions in the United States probably also benefited from an increase in the price of oil used to estimate proved reserves, which, as a result of another part of the SEC rule change, changed from the year-end value used in 2008 to the annual average value used in 2009. This resulted in a price increase from 2008 to 2009. 7 This same effect may have mitigated the decreases in oil reserves in the other FRS regions. Natural gas reserves grew modestly in the U.S. Onshore and strongly in the Other Eastern Hemisphere; they decreased notably in Europe. In the U.S. Onshore, two of the largest contributors to the increase, Chesapeake Energy and EOG Resources, reported large increases in proved undeveloped reserves and cited the SEC rule change regarding the recognition of these reserves as a major contributor to their reserve increases. 8 In the Other Eastern Hemisphere, Exxon Mobil, a large contributor to the increase, completed the initial booking of its Gorgon Jansz liquefied natural gas (LNG) project in Australia and its Papua New Guinea LNG project, and Chevron, another large contributor, added extensions and discoveries at its Gorgon Project in Australia to its Other Eastern Hemisphere reserves. 9
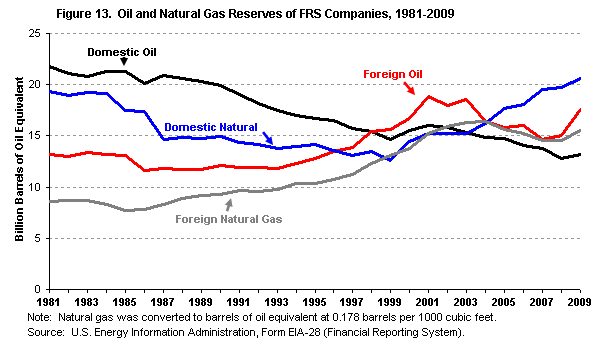
figure data
The domestic oil, domestic natural gas, foreign oil, and foreign natural gas reserves held by the FRS companies in 2009 all increased (Figure 13). A small increase in domestic oil reserves, in part likely because of the increase in the price used to value reserves, reversed their long-term declining trend, while a slightly larger increase in domestic natural gas reserves continued their decade-long climb, despite lower natural gas prices in 2009. The increase in natural gas reserves was partly driven by the changes in the rules for booking reserves that took effect in 2009 and also by the increases in unconventional gas reserves (shale gas), which have grown strongly in recent years. 10 Foreign natural gas and especially oil reserves expanded on their small prior-year increases in 2009. As with domestic reserves, it is likely that price affected the increase in foreign oil reserves. Foreign reserves of natural gas were propelled by reserves booked for huge LNG projects in Australia and Papua New Guinea.
In 2009, the growth in U.S. reserves for the FRS companies was notably less than that for the United States as a whole: 2.9 percent versus 8.7 percent, respectively, for oil and 4.2 percent versus 11.4 percent, respectively, for natural gas (Table 6). However, the annual growth rates for U.S. reserves for the FRS and the entire United States and the differences between them vary widely from year-to-year, and 2009 was for the most part anomalous for reserve growth for both the FRS and the entire country when compared to recent years. Both U.S. oil and natural gas reserves for FRS companies and for the United States grew faster in 2009 than their averages in recent years due to increases in crude oil prices and shale gas developments. However, total reserves in the United States as a whole grew faster relative to their previous averages than did FRS reserves.
A further factor in the growth of U.S. reserves for the FRS companies is the extent to which the FRS companies have been relying on foreign reserves as a source of growth. While U.S. oil reserves for the FRS companies fell 15.0 percent between 2000 and 2009, foreign oil reserves for the FRS companies increased 5.2 percent. However, for natural gas, the opposite relationship holds, with U.S. natural gas reserves growing 42.3 percent and foreign natural gas reserves growing 13.2 percent. To some extent, foreign reserves have acted as a safety valve for the FRS companies.
U.S. reserves for the FRS companies have been growing more slowly than reserves for the total United States in recent years. From 2000-2009, U.S. oil reserves for the FRS companies declined 15.0 percent and natural gas reserves grew 42.3 percent, while total U.S. oil reserves grew 1.6 percent and natural gas reserves grew 53.4 percent.
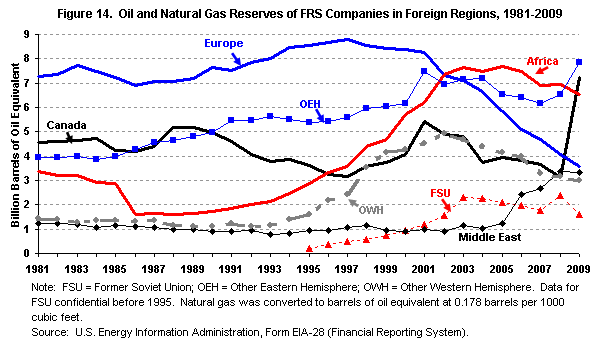
figure data
The reserves of oil and natural gas combined 11 held by the FRS companies showed sharp increases in a couple of foreign regions in 2009 (Figure 14). Most outstandingly, Canadian reserves, which had been declining since 2001, achieved a remarkable gain of 131 percent, largely from the SEC accounting rule change that allowed oil sands to be included in proved reserves for the first time in 2009. Similarly, although much less dramatically, in the Other Eastern Hemisphere, where reserves had also been declining since 2001, oil and natural gas reserves increased 20 percent in 2009 (after a 6 percent increase in 2008). Reserves in the Middle East experienced a minor decline in 2009, after successive, strong increases since 2005.
Oil and Natural Gas Reserve Additions
Reserve additions (excluding purchases of reserves) are the quantities of proved reserves added each year as extensions and discoveries of reserves, improved recovery methods used to extract reserves, or revisions to previous estimates of reserves. 12 Unless a company purchases its reserves, reserve additions are necessary for an upstream company to continue operating, since production reduces its inventory of oil and gas. By their nature reserve additions are often added in large blocks, such as when a new discovery is made or when a new technology makes certain reserves economic to produce.
Worldwide reserve additions by the FRS companies for oil and for natural gas increased in 2009, with both growing more than 50 percent (Table 7). 13 Additions were most notable in the U.S. Onshore and Canada for oil and the U.S. Onshore and the Other Eastern Hemisphere for natural gas. Declines were strongest in oil reserves in the Former Soviet Union and in natural gas reserves in the Middle East. The increase for oil in the U.S. Onshore and in Canada resulted from large positive revisions in the amount of reserves added. For natural gas in the U.S. Onshore and the Other Eastern Hemisphere, extensions and discoveries contributed the most to the increase, while the declines in the Former Soviet Union and the Middle East were caused by large negative revisions.
Oil and Natural Gas Production
Worldwide production of oil by the FRS companies was up markedly in 2009, while that of natural gas grew slightly (Table 8). The increase in oil production was the only notable one in recent years. In contrast, the increase in natural gas production was the smallest since 2006. The regions contributing the largest amounts to the increase in oil production were, most notably, the U.S. Offshore, with Africa and Canada making a strong showing. Note that worldwide oil production would have increased, even without the increase from Canada, where the inclusion of oil sands for the first time likely had a positive impact on production. Three regions showed an oil production decline, most especially the Former Soviet Union, where reserves also had a large proportional decline (Table 5). The largest contributor to the increase in natural gas production was the U.S. Onshore, with the Other Eastern Hemisphere and Africa adding substantial production. As noted above, several LNG projects ramping up in the Other Eastern Hemisphere likely contributed to the increase there.
Upstream Income
In 2009, both the domestic and foreign net incomes of the oil and natural gas production operations (oil and natural gas exploration, development, and production) of the FRS companies declined (Table 9). Revenues from the sale of oil and natural gas fell almost 40 percent (in constant 2009 dollars) 14 as average prices for oil and natural gas declined for 2009. While general operating expenses fell somewhat further (proportionally) than revenues, depreciation, depletion and amortization, which companies have little control over once a long-lived asset has been acquired, increased 24 percent domestically; however, this category fell 16 percent overseas. General operating expenses and depreciation, depletion, and amortization are the two largest categories for upstream operating costs. Combining the effects of operating revenues and operating costs, worldwide operating income fell 57 percent, a decline of $82 billion. The decline was almost evenly split between domestic and foreign operations, however, domestic operating income was reduced proportionally more because they had a smaller operating income in 2008. Non-operating income increased for foreign activities and decreased for domestic activities, the two changes largely offsetting each other worldwide. The inconsiderable amount of other income did little to boost domestic results, even with the help of the fall of domestic income taxes by 84 percent. These domestic results, together with the results for foreign operations and non-operating activities, yielded a fall in worldwide net income of 43 percent, in domestic income by 67 percent, and in foreign income by 23 percent. However, it must be remembered that the results of 2008 were in part the result of some of the highest prices for crude oil and natural gas since World War II, so 2008 net income was particularly high.
Lifting Costs
Lifting costs (also called production costs) are the costs to operate and maintain wells and related equipment and facilities per barrel of oil equivalent (boe) of oil and gas produced by those facilities after the hydrocarbons have been found, acquired, and developed for production. 15 Direct lifting costs are total production spending minus production taxes (and also minus royalties in foreign regions) divided by oil and natural gas production in boe. Total lifting costs are the sum of direct lifting costs and production taxes.
Reversing an almost decade-long upward trend, worldwide total lifting costs for the FRS companies fell $1.19 per boe, to $11.51per boe, in 2009 (Table 10). Total lifting costs also fell in each of the FRS regions, except Canada, where they rose $2.49 dollars, probably reflecting the inclusion of oil sands there in 2009. 16 The FRS regions with the largest decline in total lifting costs, the U.S. Offshore, the Middle East, and the Other Eastern Hemisphere, sustained declines of $3.83, $2.91, and $2.61 dollars, respectively.
Production taxes were the major contributor to the decline in total lifting costs. Worldwide they declined $0.84 per boe in 2009, which is 70 percent of the decline in total lifting costs (Table 9). Production taxes typically rise and fall with changes in the prices of oil and natural gas, both of which fell in 2009. All FRS regions except Canada, where the increase was small, had declines in production taxes in 2009, with the largest declines in the Middle East and the Other Eastern Hemisphere. The United States, with a small decline, became the highest-production-tax region for the FRS companies. Canada and the Former Soviet Union were the lowest production tax regions in 2009, as they were in 2008.
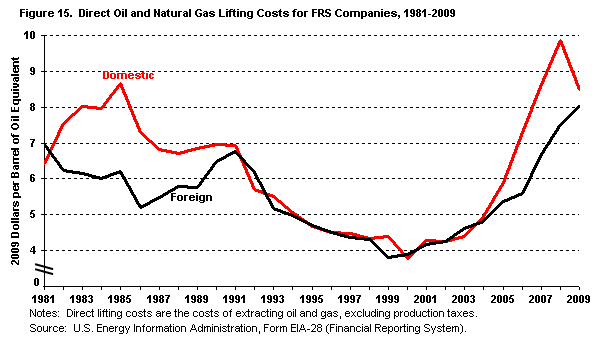
figure data
Direct lifting costs for the United States took a dramatic downward turn in 2009, falling at the fastest rate (-14 percent) since reaching their nadir in 2000 (Figure 15). This plunge follows 8 years of essentially uninterrupted growth. Direct lifting costs in combined foreign regions extended their climb that also began in 2000. But their climb has been more deliberate than the growth in domestic lifting costs. Domestic direct lifting costs still exceed foreign costs by $0.47 per boe, even with the domestic decline in 2009.
Finding Costs
Finding costs are the average costs of adding proved reserves of oil and natural gas via exploration and development activities and the purchase of properties that might contain reserves. These costs are measured for oil and natural gas on a combined basis in dollars per boe. Ideally, finding costs would include all costs incurred (no matter when these costs were incurred or recognized on a company's books) in finding any particular proved reserves (not including the purchases of already discovered reserves). In practice, and as reported here, finding costs are actually measured as the ratio of exploration and development expenditures (including expenditures on unproved acreage but excluding expenditures on proved acreage) to proved reserve additions (excluding net purchases of proved reserves) over a specified period of time. 17 Finding costs are generally calculated in Performance Profiles as a weighted average over a period of 3 years.
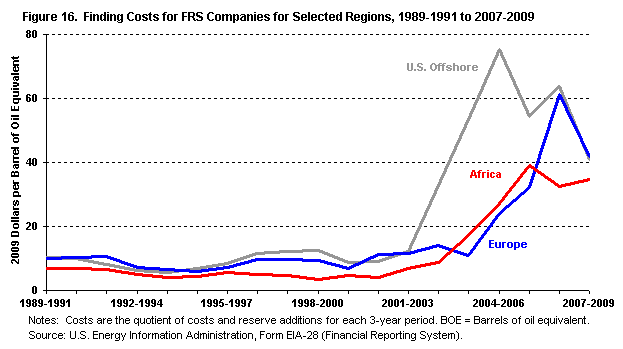
figure data
Average worldwide finding costs for the FRS companies decreased $5.79 per boe of reserves added in the 2007-2009 period compared to the 2006-2008 period (Table 11). Finding costs declined in all FRS regions except the Former Soviet Union, Africa, and the Middle East. Europe, which had the highest finding costs of all of the foreign FRS regions in 2006-2008, had a large fall in costs in 2007-2009, $19.66 per boe, but, nonetheless, became the highest cost of any of the regions, worldwide (Figure 16). That is because the former highest cost region, the U.S. Offshore, fell the most in 2007-2009, $23.02, and lost its position as the highest cost region. Canada displayed a large decline in part likely because of the inclusion of oil sands in 2009. 18 Of the regions with increasing finding costs, the largest increase was in the Former Soviet Union, with a modest increase of $3.38.
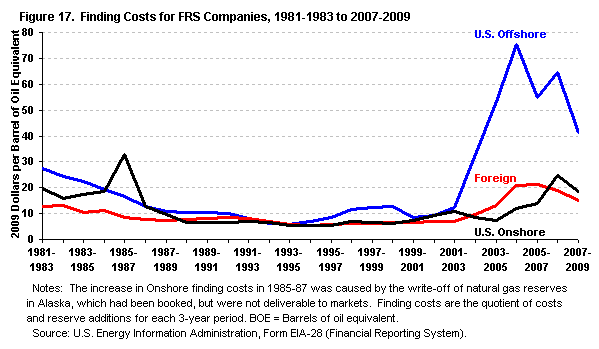
figure data For the U.S. Onshore, U.S. Offshore, and Foreign regions, finding costs fell the most in the U.S. Offshore in 2007-2009, bringing its costs closer to the lower cost U.S. Onshore and Foreign regions (Figure 17). The U.S. Offshore has had the highest finding costs of these three regions since 2001-2003, and the fall in its finding costs was its largest since 1981-1983, when data are first available. 19 U.S. Onshore and Foreign finding costs also fell in 2007-2009, but not as steeply as the U.S. Offshore. All three regions experienced climbing finding costs in the mid-2000s, with those of the U.S. Offshore skyrocketing. The increases for the U.S. Offshore were reversed in the 2005-2007 period, with the region falling an amount that was at the time the largest of any decline of the three regions since 1981-1983.
Upstream Costs
Total upstream costs are the sum of finding costs and lifting costs. 20 Because, in the last several years, finding costs usually have been much larger than lifting costs, the calculations of upstream costs have been dominated by finding costs. Upstream costs in the aggregate fell almost $5 per boe for the FRS companies for the years 2007-2009 (Table 12). The Former Soviet Union and Africa were the only regions that had increased upstream costs, at $4.26 per boe and $3.07 per boe, respectively, while the U.S. Offshore, Europe, and Canada had conspicuous declines.