About the Financial Reporting System Companies
Changes in the Financial Reporting System Companies for the 2009 Reporting Year
For the 2009 reporting year, 30 major energy companies (Table 20) reported their financial 89 and operating data to the U.S. Energy Information Administration's (EIA) Financial Reporting System (FRS) on Form EIA-28. The number of companies (referred to as the FRS companies in this report) increased by three from 2008 with the addition of Alon USA, Chalmette, and Western Refining.
Alon USA, which initially entered the U.S. refining industry with its August 2000 acquisition of the Big Spring, Texas, refinery of FRS respondent Fina, acquired three refineries (two that were operational) during 2006, more than doubling its refinery capacity, but leaving it just below the threshold for inclusion in the FRS. However, its July 2008 acquisition of FRS respondent Valero's Krotz Springs, Louisiana, refinery increased its corporate capacity well beyond the threshold of 1 percent of U.S. crude oil distillation capacity for inclusion in the FRS. 90 The company was subsequently added for the 2009 reporting year. Alon's refinery capacity is concentrated on the west coast and the Gulf coast areas.
Chalmette, a refinery joint venture between Exxon Mobil Corporation and Petroleos de Venezuela, S.A. (PdVSA, the state oil company of Venezuela) is a 192,500 barrels-per-day refinery in Chalmette, Louisiana. The joint venture began in 1998. 91
Western Refining Inc., entered the U.S. refining industry with its August 2003 acquisition of the 99,000 bpd El Paso, Texas, refinery of FRS respondent Chevron. 92 Subsequently, Western acquired Giant Industries and its 101,250 bpd corporate capacity in May 2007. Western has since suspended refining operations at its Bloomfield, New Mexico, refinery effectively transforming it into a product terminal, in November 2009. 93 More recently, Western suspended refining operations at its Yorktown, Virginia refinery due to poor refinery economics, also transforming it into a product terminal. 94 All of Western's remaining operating refinery capacity is in the Gulf Coast region.
Although the composition of the FRS group of companies changes over time, the changes usually are incremental, as evident from the above discussion. A company is added to the survey when, through growth or acquisition, it meets the criteria classifying it as a major energy company. Typically, no more than two companies are added to the survey in any given year. The new companies usually are relatively small compared with the existing FRS group, so the effect on the aggregate totals is marginal. The year 1998 was an exception. Because of a change in the FRS criteria, 11 companies were added to the FRS group. Companies rarely exit unless through merger, in which case the assets of the exiting company are absorbed into the surviving company. Thus, despite occasional year-to-year changes in the FRS group composition, comparisons are still meaningful and informative.
The FRS Companies' Importance in the U.S. Economy
The FRS companies occupy a significant position in the U.S. 95 economy. In 2009, operating revenues of the FRS companies totaled $1.297 trillion, which is equal to 13 percent of the $9.763 trillion in revenues of the Fortune 500 corporations. 96 , 97
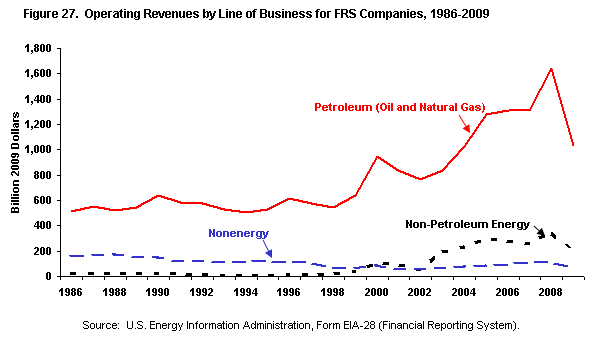
Figure Data
The reporting companies engage in a wide range of business activities, but their most important activities are in the energy sector. They derived about 94 percent, or $1,223 billion, of allocated operating revenues 98 from energy lines of business and derived nearly all of these revenues from their core petroleum operations (Figure 27). A majority of these companies are multinational, with 40 percent of the majors' net investment located abroad. Worldwide petroleum and natural gas market developments are of primary importance to these companies' financial performance.
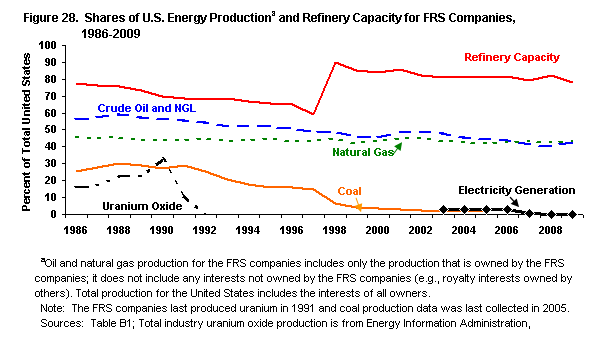
Figure Data
In 2009 the FRS companies accounted for 43 percent of total U.S. crude oil and natural gas liquids (NGL) production, 99 43 percent of natural gas production, 78 percent of U.S. refining capacity, and 0.3 percent of U.S. electricity net generation (Figure 28). During 2009, these companies devoted about 85 percent of their assets and 87 percent of new investments to sustaining various aspects of petroleum production, processing, transportation, and marketing.
Energy production, other than petroleum, has been a relatively small but growing part of the FRS companies' operations since 1994. During 2009, the combined operating revenues of the downstream natural gas, electricity, and other energy operations 100 of the FRS companies totaled $186 billion, or 14 percent of allocated revenues. The importance of actual electric power operations to the FRS companies, which substantially declined with the exit of Dominion Resources for the 2007 reporting year, 101 recovered marginally in 2009 as the FRS share of U.S. electricity generation capacity increased from 0.2 percent in 2008 to 0.3 percent in 2009, leaving electricity trading activity as the primary FRS involvement in electricity.
Nonenergy businesses, mainly chemicals, accounted for 6 percent, or $74 billion, of the FRS companies' allocated revenues in 2009. During the 1980s, the FRS companies were major producers of domestic uranium. However, FRS domestic production of uranium oxide last occurred in 1991.