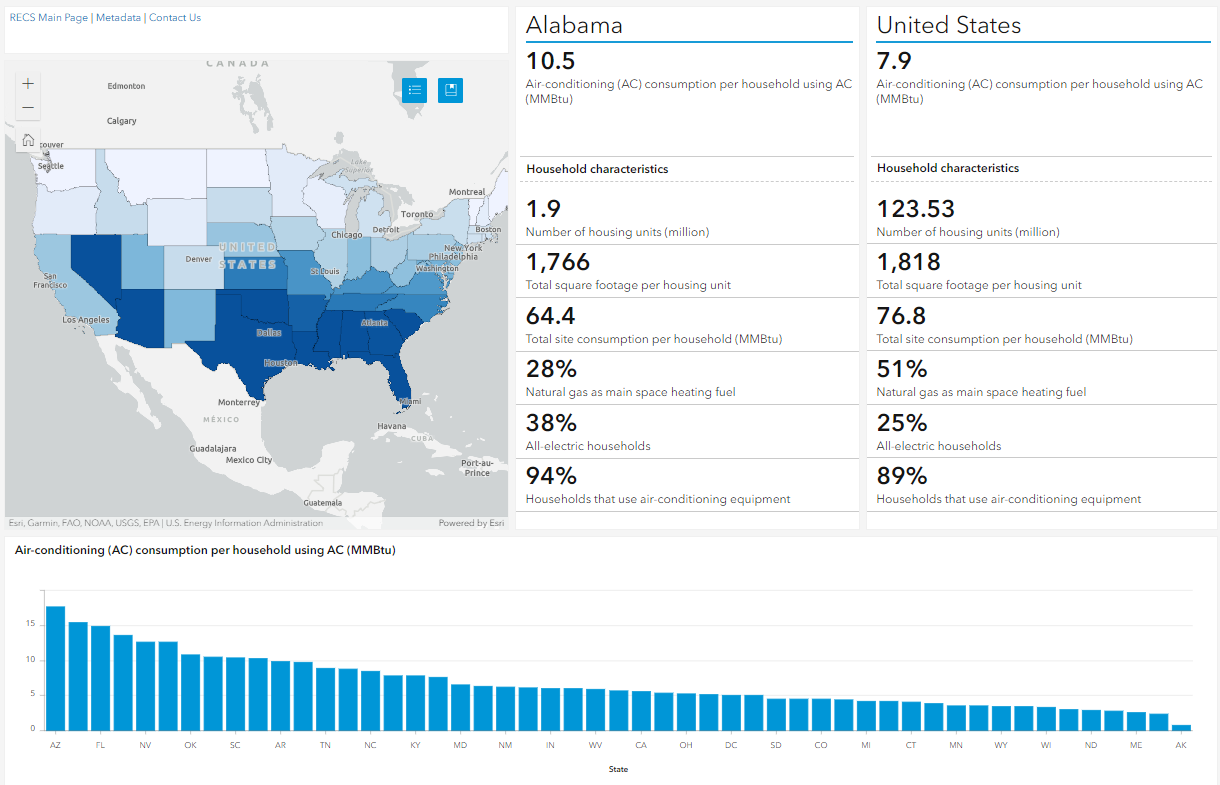
 View the dashboard ›

Air conditioning in nearly 100 million U.S. homes
RECS 2009 — Release date: August 19, 2011
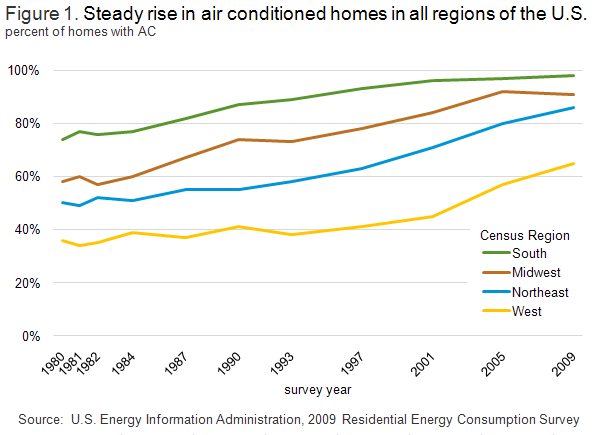 figure dataExcept in the temperate climate regions along the West coast, air conditioners (AC) are now standard equipment in most U.S. homes (Figure 1). As recently as 1993, only 68% of all occupied housing units had AC. The latest results from the 2009 Residential Energy Consumption Survey (RECS) show that 87 percent of U.S. households are now equipped with AC. This growth occurred among all housing types and in every Census region. Wider use has coincided with much improved energy efficiency standards for AC equipment, a population shift to hotter and more humid regions, and a housing boom during which average housing sizes increased.
Regional differences in type of air conditioning used
Cooled homes have either central AC systems or room air conditioners, which are individual window or wall units (room conditioning). The type of AC equipment used differs across regions. Central air systems are most common in the South, Midwest, and West, while room conditioners are most common in the Northeast (Table 1). Variation within regions can be dramatic: 69% of air conditioned homes in New Jersey use central equipment compared to 28% of homes in neighboring New York. This difference is largely due the different mix of housing types and age of housing stock between the two States.
| Northeast | Midwest | South | West | |
|---|---|---|---|---|
| Of homes that use AC, percent that use..... | ||||
| Central AC equipment | 44% | 76% | 85% | 74% |
| Window/wall AC units | 58% | 26% | 16% | 27% |
| *Some homes have both central and window/wall AC, so totals will add to more than 100% | ||||
Increase in AC saturation is tempered by regional usage patterns
Regional differences are apparent in air conditioning usage. Southern households are almost twice as likely to use their central and room air conditioning equipment all summer as those in other regions (Table 2). Homes in the South are also least likely to have a programmable thermostat connected to the central air conditioner, while homes in the West are most likely. Programmable thermostats are designed to reduce consumption by automatically and routinely cycling down the unit when more intensive cooling is not needed. Consumers could reduce overall cooling costs by installing and setting a programmable thermostat.
| Northeast | Midwest | South | West | |
|---|---|---|---|---|
| Of homes that use central AC, percent that have... | ||||
| Central equipment used all summer | 35% | 37% | 67% | 38% |
| A programmable thermostat | 60% | 47% | 38% | 65% |
Housing type and age drives variation in air conditioning saturation
Housing type influences the type of air conditioning used as well as the overall saturation of air conditioning in U.S. homes. Air conditioning equipment is more common in single family homes (89%) than in housing units in apartment buildings (82%). While 84% of units in larger (5 or more unit) apartment buildings have air conditioning, in smaller (2 to 4 units) buildings that percentage drops to 77%.
While RECS data indicate that more older homes are adding window units or being retrofitted with central air conditioning, new construction is driving the saturation. Nearly 90% of new homes are built with central air conditioning (Figure 2). When central air conditioning is included at the time of construction, installation is easier and consumers can amortize costs over the life of a mortgage. In contrast, air conditioning retrofits or upgrades are often financed separately from a mortgage, over a much shorter time period at higher interest, and may require capital improvements such as the addition of ventilation systems and ductwork.
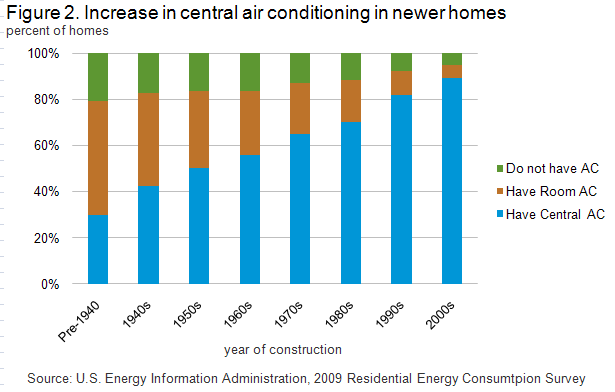 figure data
The rise of air conditioning systems has also influenced the type of home space heating systems found in newer construction. Central air conditioning and central space heating equipment often work in tandem or as a unified system. About 91% of homes built since 2000 have a main space heating system that includes central ducts; for homes built before 1940, that number is just 50%.
Less efficient cooling alternatives are found in apartments and lower-income homes
Although structural and geographic characteristics such as climate, housing type and ownership influence where air conditioning appears, access to air conditioning by low income households is much lower relative to other households.
Overall, 18 percent of households below the poverty line do not have any air conditioning equipment at all. About a third of households below the poverty line use room air conditioning compared to 15% of households with an income above $100,000. In contrast, about 75% of households with incomes above $100,000 use central air conditioning compared to just 44% of households below the poverty line. The share of room air conditioners continues to drop as more households, especially higher income and owner occupied households, choose central air conditioning equipment.
Only 25% of all homes currently have room air conditioning units. Room air conditioning units can be a cost-effective alternative in climate regions with moderate summer temperatures. About 30% of households in the cold or very cold climate regions use room air conditioning compared to 19% in other regions. Households choose room air conditioning units in areas where cooling is only necessary a few times a year. Conversely, central air conditioning is more common in hotter climates because it can be used more intensively and efficiently relative to room air conditioning units.
There is a significant business opportunity to retrofit homes with new, more efficient air conditioning equipment that would reduce annual cooling costs to households. For example, 20% of the homes built during the 1980s have air conditioning equipment over 20 years old. Many U.S. homes could also benefit from regular maintenance, as only 42% of those using central air equipment service it annually.