Older than 4380 days
Quarterly Coal Report
Oct 8, 2014
U.S. coal production during second quarter 2014 totaled 245.8 million short tons. This was 0.3% higher than the previous quarter, and 1.2% higher than second quarter 2013. Second quarter 2014 U.S. coal exports (24.6 million short tons) dropped 16.5% from second quarter 2013, and dropped 11.4% from first quarter 2014. U.S. coal imports in second quarter 2014 increased to 3.5 million short tons from 2.4 million short tons in first quarter 2014. U.S. coal consumption totaled 212.9 million short tons in second quarter 2014; this was 14.4% lower than the 248.6 million short tons reported in first quarter 2014 and 1.7% lower than the 216.5 million short tons reported in second quarter 2013.
All data for 2012 and prior years are final. All data for 2013 and 2014 are preliminary.
Short-Term Energy and Winter Fuels Outlook
Oct 7, 2014
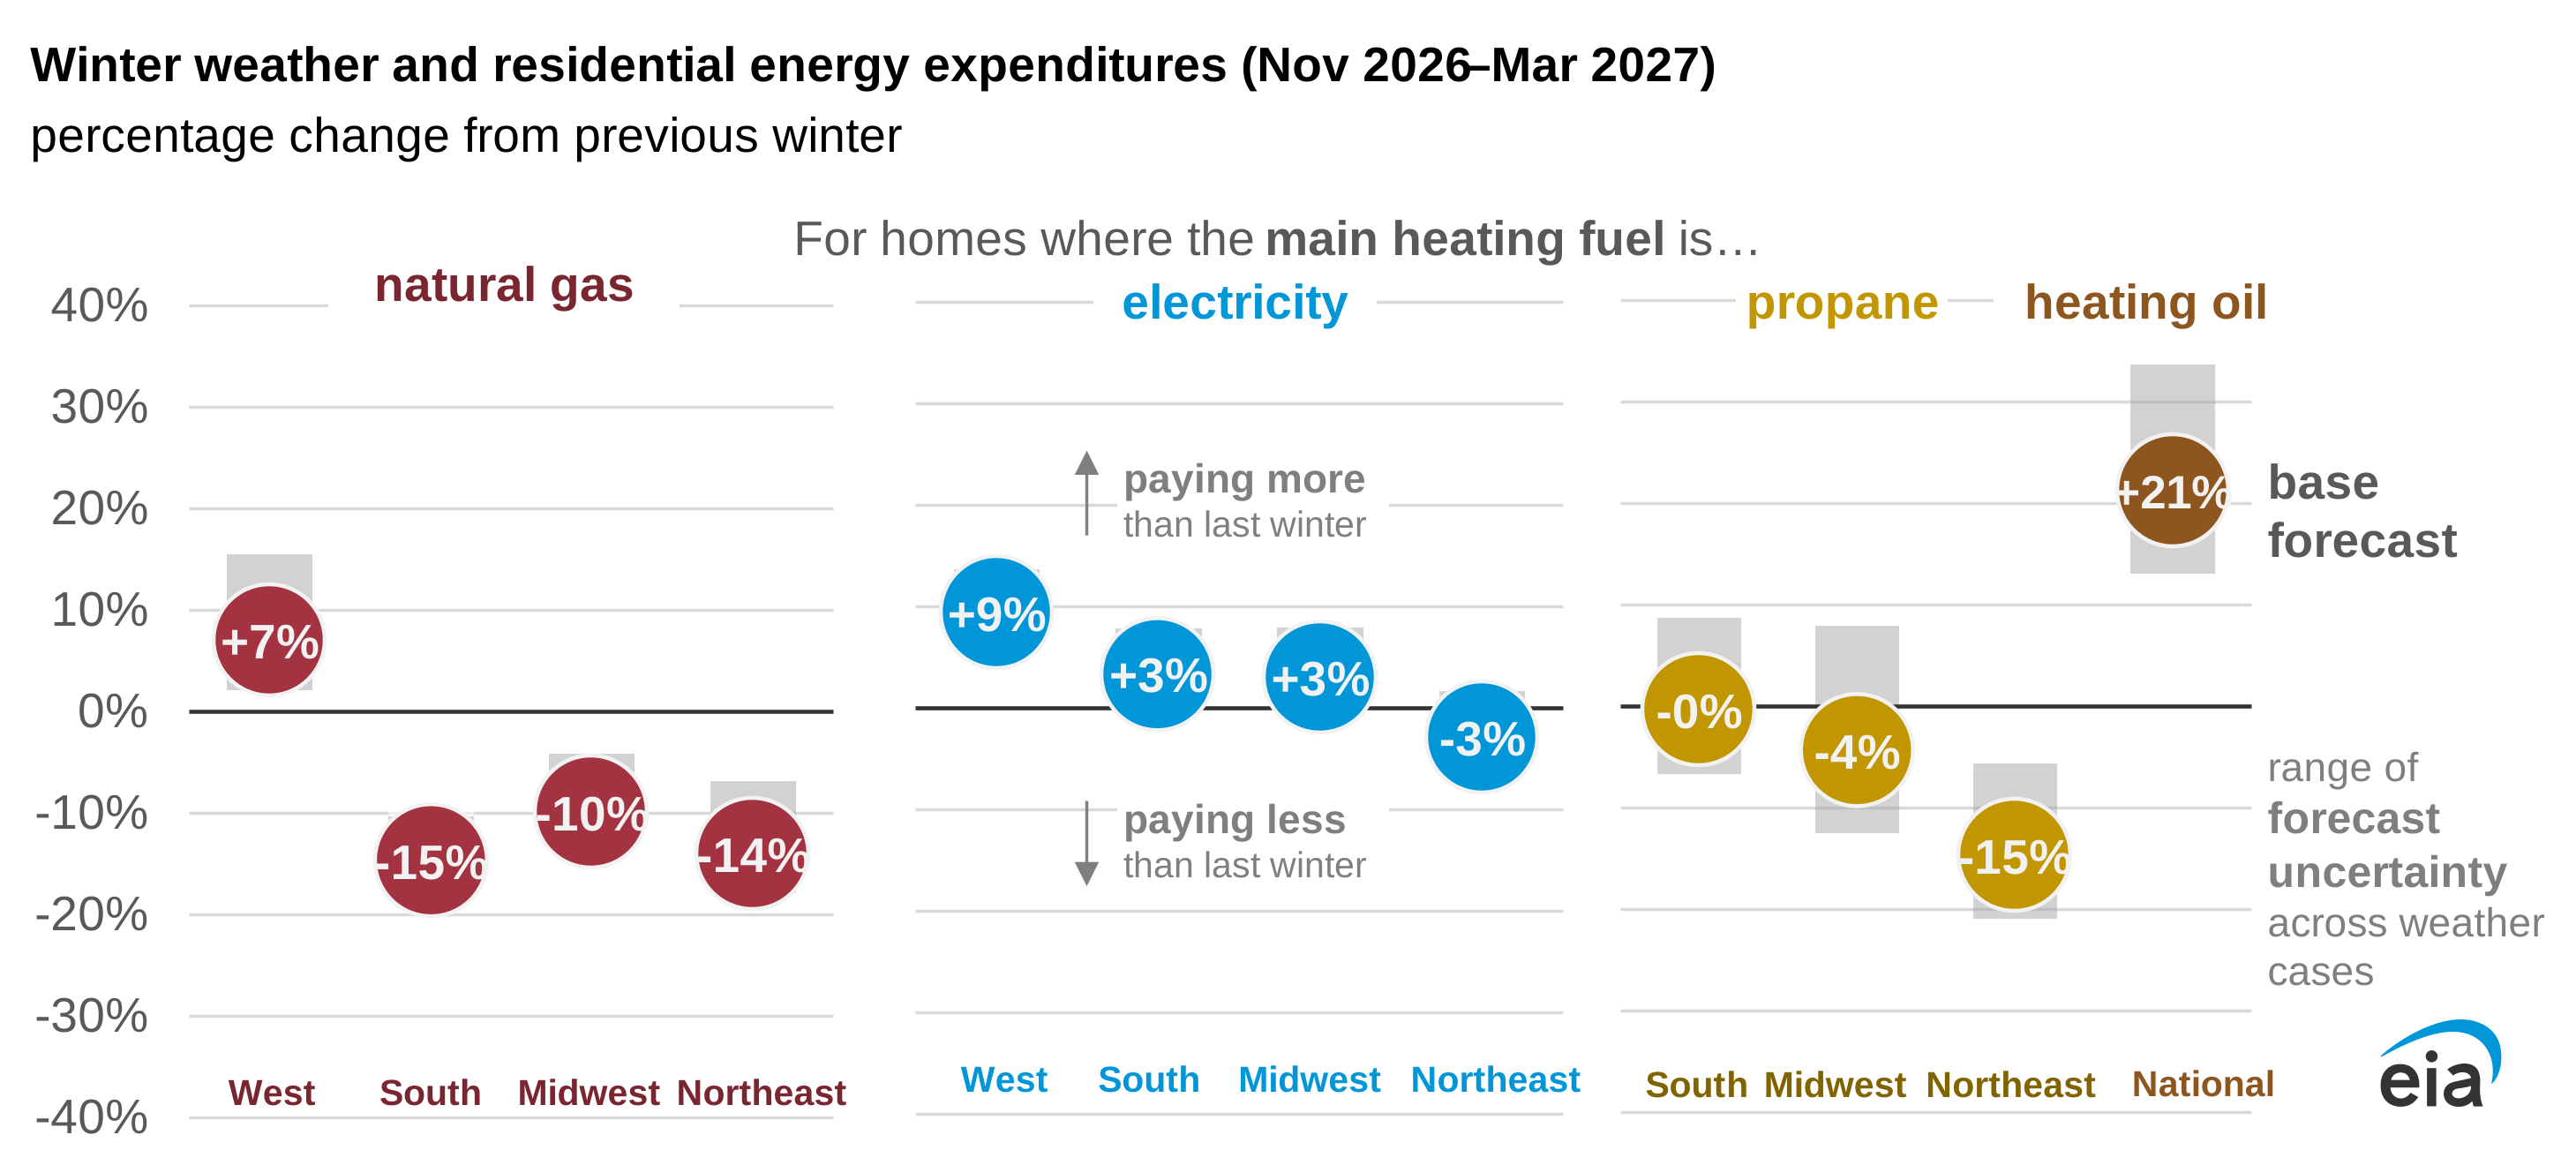
EIA projects average U.S. household expenditures for natural gas, heating oil, electricity, and propane will decrease this winter heating season (October 1 through March 31) compared with last winter, which was 11% colder than the previous 10-year average nationally. Projected average household expenditures for propane and heating oil are 27% and 15% lower, respectively, because of lower heating demand and prices. Lower heating demand and higher prices contribute to natural gas and electricity expenditures that are 5% and 2% lower than last winter.
Short-Term Energy Outlook - Market Prices and Uncertainty Report
Oct 7, 2014
International crude oil prices fell in August and remain near their lowest levels of 2014. The North Sea Brent front month futures price settled at $101.83/barrel on September 4, a decrease of $3.01/barrel from August 1.
Quarterly Coal Distribution Report – Second Quarter 2014
Oct 2, 2014
Provides detailed U.S. domestic coal distribution data for April – June 2014, excluding waste coal and imports, by coal origin, coal destination, mode of transportation, and consuming sector. Quarterly coal distribution data for all years are preliminary and will be superseded by the release of the corresponding “Annual Coal Distribution Report.”
Petroleum Marketing Monthly
Oct 1, 2014
The October 2014 Petroleum Marketing Monthly (PMM), with data through July 2014, presents monthly and annual price and volume statistics covering crude oil and refined products sales in the United States. Also in this edition of the PMM, updated state motor fuel tax information is available in Table EN1.
Preliminary July 2014 data show crude oil prices declined in all sales categories. Refiner gasoline prices show significant month-on-month decreases, while No. 2 distillate prices declined for the fifth month in a row. U.S-level Prime Supplier data show sales of all major finished products increased during July.
Natural Gas Monthly
Sep 30, 2014
The September Natural Gas Monthly, with data through July 2014, has been released.
• Preliminary dry gas production for July 2014 of 2,183 billion cubic feet (Bcf) or 70.4 Bcf/day. This is the fifth consecutive month where the Bcf/day dry production value set the record for the highest ever for any month, with July’s 70.4 Bcf/day being slightly higher than June’s revised 70.3 Bcf/day.
• Preliminary total consumption for July 2014 is 1,878 Bcf or 60.6 Bcf per day, a decrease of 2% from last July’s 1,918 Bcf or 61.9 Bcf/day. This was the lowest consumption for the month since 2010.
• Deliveries to residential consumers for July 2014 are 112 Bcf or 3.6 Bcf/day; commercial deliveries are 137 Bcf or 4.4 Bcf/day; and industrial deliveries are 605 Bcf or 19.5 Bcf/day. All were relative stable from last year, each changing less than 4% from July 2013. However, electric power deliveries for July (840 Bcf or 27.1 Bcf/day) are down 7.3% from July 2013, and are the lowest for the month since 2009.
Monthly Natural Gas Gross Production Report
Sep 30, 2014
Monthly natural gas gross withdrawals estimated from data collected on Form EIA-914 (Monthly Natural Gas Production Report) for Federal Offshore Gulf of Mexico, Texas, Louisiana, New Mexico, Oklahoma, Texas, Wyoming, other states and Lower 48 states. Alaska data are from the state of Alaska and included to obtain a U.S. total.
Canada Country Analysis Brief
Sep 30, 2014
Canada’s oil sands are a significant contributor to the recent growth and expected future growth in the world’s liquid fuel supply. They comprise most of the country’s proved oil reserves, which rank third globally.
Company Level Imports
Sep 29, 2014
Imports data at the company level collected from the EIA-814 Monthly Imports Report.
Petroleum Supply Monthly
Sep 29, 2014
Supply and disposition of crude oil and petroleum products on a national and regional level. The data series describe production, imports and exports, movements, and inventories.
Malaysia Country Analysis Brief
Sep 29, 2014
Malaysia is a significant oil and natural gas producer in Asia and is strategically located amid important routes for seaborne energy trade. The country’s oil reserves are the fourth highest in the Asia-Pacific region after China, India, and Vietnam. Also, Malaysia was the world’s second largest exporter of liquefied natural gas after Qatar in 2013. Declining oil and natural gas production growth and rising domestic and regional energy demand are prompting Malaysia to invest in downstream infrastructure such as oil and natural gas import terminals, storage facilities, and refining capacity to ensure adequate energy supply.
Monthly Energy Review
Sep 25, 2014
The September report includes the first complete set of preliminary statistics for the first 6 months of 2014 for U.S. total energy consumption, production, trade, and carbon dioxide emissions. Preliminary data indicate that U.S. total primary energy consumption equaled 50 quadrillion Btu, a 3% increase from the first 6 months of 2013. U.S. total primary energy production totaled 42 quadrillion Btu, a 5% increase. U.S. primary energy net imports totaled 5 quadrillion Btu, a 17% decrease.
Yemen Country Analysis Brief
Sep 25, 2014
Although Yemen is not a major hydrocarbon producer relative to several other countries in the Middle East, the country has sufficient oil and natural gas resources for both domestic demand and exports. However, Yemen's difficult security environment hinders the production and transport of those resources.
Prime Supplier Report
Sep 22, 2014
The latest Prime Supplier Report presents data collected through July 2014 on Form EIA-782C, "Monthly Report of Prime Supplier Sales of Petroleum Products Sold for Local Consumption." These data measure primary petroleum product deliveries into the states where they are locally marketed and consumed.
State Energy Profiles: New Data for June and July 2014
Sep 18, 2014
New monthly data are available for electricity, petroleum, and natural gas series.
East China Sea Regional Analysis Brief
Sep 17, 2014
The East China Sea is a semi-closed sea bordered by the Yellow Sea to the north, the South China Sea and Taiwan to the south, Japan's Ryukyu and Kyushu islands to the east and the Chinese mainland to the west. Studies identifying potentially abundant oil and natural gas deposits have made the sea a source of contention between Japan and China, the two largest energy consumers in Asia. Both countries are interested in extracting hydrocarbon resources, particularly natural gas, from the East China Sea to help meet domestic demand. However, the unresolved territorial disputes and limited evidence thus far of hydrocarbon reserves make it unlikely that the region will become a major new source of hydrocarbon production.