Sales of Fossil Fuels Produced from Federal and Indian Lands, FY 2003 through FY 2014
Release date: July 17, 2015
Summary
The U.S. Energy Information Administration (EIA) estimates that total sales of fossil fuels from production1 on federal and Indian lands increased slightly (less than 0.2%) during fiscal year2 (FY) 2014. Total fossil fuels production on federal lands decreased by 24 trillion British thermal units (Btu) in FY 2014 (Table 1), while total fossil fuels production on Indian lands increased by 52 trillion Btu (Table 2).
In FY 2014 (compared with FY 2013), crude oil and lease condensate production on federal and Indian lands increased 7%, natural gas production declined 7%, natural gas plant liquids production increased by 8%, and coal production increased slightly.
| Land | Crude oil and lease condensate | Natural gas | Natural gas plant liquids | Coal | All fossil fuels |
|---|---|---|---|---|---|
Federal |
Up 37 mmbbl, +6% |
Down 284 bcf, -7% |
Up 9 mmbbl, +8% |
Up 1 mmst, +0.2% |
-24 trillion Btu,-0.2% |
Indian |
Up 10 mmbbl, +22% |
Up 0.3 bcf, +0.1% |
Up 0.6 mmbbl, +16% |
Down 0.3 mmst,-1.6% |
+52 trillion Btu,+5.7% |
Notable developments in FY 2014 include:
- A 46.5 million barrel increase (7%) in oil production on federal and Indian lands, led by increases in the federal offshore Gulf of Mexico, North Dakota, and New Mexico
- A 284 billion cubic feet decline (-7%) in natural gas production, with most of that decrease in the federal offshore Gulf of Mexico and Wyoming
Breakdowns by state and area of the fuel production volumes on federal and Indian lands show that:
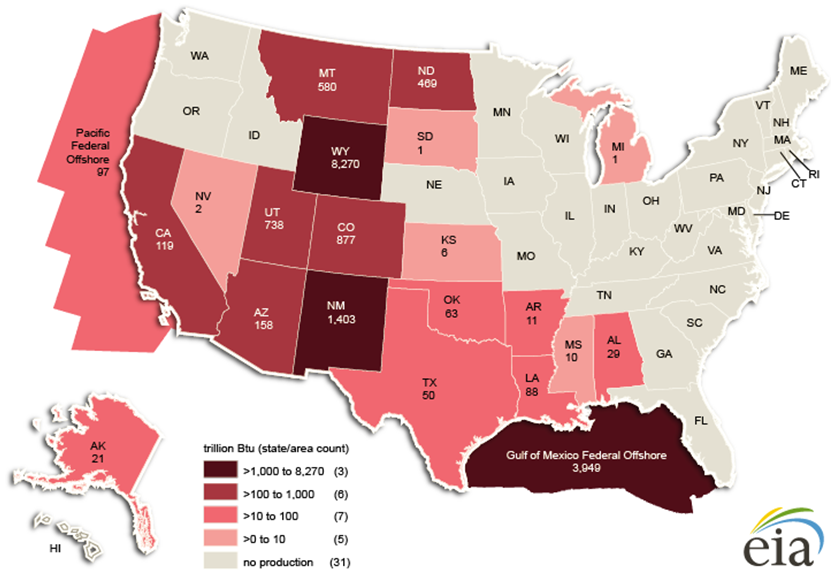
- The federal Gulf of Mexico produced 68% of the federal and Indian lands crude oil total in FY 2014
- Wyoming, the federal Gulf of Mexico, New Mexico, and Colorado together represented 86% of total production of natural gas on federal and Indian lands in FY 2014
- Wyoming produced 80% of the coal on federal and Indian lands in FY 2014
EIA's estimates are based on data provided by the U.S. Department of the Interior's (DOI) Office of Natural Resources Revenue (ONRR) and include sales of production from federal onshore and offshore lands, and from Indian lands.3EIA summarizes total sales of fossil fuels produced on federal and Indian lands in common energy units (British thermal units, or Btu) to allow for aggregation across fuels, including crude oil and lease condensate, natural gas, natural gas plant liquids(NGPL), and coal (Tables 1 and 2). The data presented in this report update the data previously reported by EIA4 for FY 2003 through FY 2013.
The sales reported by ONRR are a reasonable proxy for marketed production for a fiscal year. Sales are assigned to the fiscal year in which the sales were made rather than when royalties were collected. They also include production leaving the lease that is exempt from royalty payments under various royalty relief programs
Sales from production on federal and Indian lands
Federal lands
Coal represented 51% of fossil fuel sales from production on federal lands in FY 2014, measured in common Btu units, followed by crude oil and lease condensate (24%), natural gas (23%), and natural gas plant liquids (NGPL) (3%). Total fossil fuels sales from production on federal lands decreased slightly from 15,999 trillion Btu in FY 2013 to 15,975 trillion Btu in FY 2014 (Table 1). On federal lands (only) in FY 2014:
- Sales of crude oil5 from federal lands increased 6%, from 614 million barrels in FY 2013 to 651 million barrels in FY 2014. Federal offshore and onshore oil production increased by 5% and 9%, respectively (Table 3). Despite this increase, crude oil production from federal lands as a share of total U.S. crude oil production decreased from 23% in FY 2013 to 21% in FY 2014. This decrease in the federal lands share of total production was the result of the 16% increase in total U.S. crude oil production.6
- Sales of natural gas from federal lands decreased 7%, from 3,835 billion cubic feet in FY 2013 to 3,551 billion cubic feet in FY 2014. Both offshore (11%) and onshore volumes (6%) declined (Table 4). Natural gas production on federal lands dropped to 14% of the U.S. total in FY 2014 from 16% in FY 2013. The largest portion of the drop in natural gas production on federal lands was from declines in the Gulf of Mexico and Wyoming.
- Sales of natural gas plant liquids (NGPL) produced on federal lands increased 8%, from 108 million barrels in FY 2013 to 117 million barrels in FY 2014. Both onshore (9%) and offshore volumes (7%) increased (Table 5). NGPL production from federal lands decreased from 12% to 11% of the U.S. total in FY 2014.
- Coal sales from production on federal lands increased slightly (0.2%) from 401 million short tons in FY 2013 to 402 million short tons in FY 2014 (Table 6). Coal produced on federal lands accounted for 41% of the U.S. total in FY 2014, up from 40% in FY 2013.
Indian lands
Coal represented 39% of fossil fuel sales from production on Indian lands in FY 2014, measured in common Btu units, followed by crude oil (33%), natural gas (26%), and NGPL (2%). Total fossil fuels sales from production on Indian lands increased 6% from 916 trillion Btu in FY 2013 to 968 trillion Btu in FY 2014 (Table 2), as oil and NGPL production increased, natural gas production remained level, and coal production declined. On Indian lands (only) in FY 2014:
- Sales of crude oil produced on Indian lands increased 22%, increasing from 46 million barrels in FY 2013 to 56 million barrels in FY 2014 (Table 3). The increase in Indian lands oil production was attributable mostly to gains on tribal lands in North Dakota (Bakken formation) and, to a lesser extent, gains on tribal lands in New Mexico and Utah.
- Sales of natural gas from Indian lands remained at 241 billion cubic feet in FY 2014 (Table 4).
- Sales of NGPL increased slightly and coal production decreased slightly on Indian lands in FY 2014, but these changes were negligible in the context of reported units (million short tons) in the tables of this report. Therefore, the production of NGPL and coal from Indian lands in FY 2014 matches that of FY 2013, 4 million barrels and 19 million short tons, respectively (Tables 5 and 6).
Trends in federal and Indian lands production from FY 2003 through FY 2014
Overall fossil fuel production from federal lands generally declined between FY 2003 and FY 2014, down 21% in FY 2014 compared with FY 2003 (Table 1). This trend is primarily the result of a steady decline in federal offshore natural gas production between FY 2003 and FY 2014 and the 9% drop in coal production from federal lands from FY 2012 to FY 2013.
Conversely, overall fossil fuel production from Indian lands has risen since 2009 because of increasing crude oil and NGPL production. Total fossil fuels production on Indian lands in FY 2014 fell just short of surpassing the amount produced in FY 2003 (less than a 1% difference).
- Crude oil production from federal lands decreased 4% between FY 2003 and FY 2014 (Figure 1, Table 3). Production in the federal offshore declined 13% over that period, which outweighs the 49% increase in the federal onshore volumes over the same period. In FY 2014, the federal offshore still had the majority (77%) of total federal crude oil production, but its share declined compared with FY 2003 when it comprised 85% of all federal crude oil production.
- For the past six consecutive fiscal years, 2009-2014, oil production on Indian lands has increased (Figure 2). Between FY 2003 and FY 2014, oil production on Indian lands increased 460%.
- Natural gas production from federal lands has declined steadily, down 48% in FY 2014 from 2003(Figure 1, Table 4). The once-larger federal offshore volumes declined every year through FY 2014, down 76% from FY 2003. That decrease was partially offset by the now-larger onshore volumes, which increased 9% over the same time period. This declining natural gas production from federal lands, coupled with increasing total U.S. natural gas production7, steadily reduced the federal lands share of total U.S. natural gas production.
- NGPL production from federal lands increased 26% between FY 2003 and FY 2014 (Figure 1, Table 5). Following the natural gas trend, the once-larger federal offshore NGPL volumes declined 6%, while the now-larger onshore NGPL volumes increased 64% over the same period. NGPL production on Indian lands in FY 2014 was 4 million barrels, and while this level is twice the amount produced from Indian lands in FY 2003, it is a small volume compared with what was produced on federal lands (117 million barrels) in FY 2014.
- Federal land coal production declined 8% between FY 2003 and FY 2014 (Figure 1, Table 6). Coal production on Indian lands declined 37% over the same period. U.S. total coal production was an estimated 1,072 million short tons in 2003 and declined to 997 million short tons in 2014 (a 7% decline). Coal production from federal and Indian lands totaled 421 million short tons (42% of the U.S. total) in FY 2014.
Total fossil fuel production from Indian lands increased each year since FY 2010. Increases in oil production have almost completely offset the decreases in coal production and natural gas production between FY 2003 and FY 2014 (Table 2). The annual totals are less than 1% different, but the FY 2003 level was slightly higher.
- Crude oil production from Indian lands increased 460% from 10 million barrels in FY 2003 to 56 million barrels in FY 2014. Almost all of this increase took place since FY 2010 (Figure 2, Table 3), and mostly in North Dakota (primarily the Fort Berthold Indian Reservation in the western part of the state, part of the Bakken/Three Forks tight oil play).
- Natural gas production and coal production from Indian lands declined between FY 2003 and FY 2014 by 15% and 37%, respectively. Except for a small deviation in FY 2011, natural gas and coal production have steadily declined since FY 2005 (Figure 2).
Footnotes
1Throughout this report, the term "production" means sales from production.
2The U.S. government's fiscal year runs from October 1 through September 30.
3Includes offshore and onshore areas the federal government owns or administers, including American Indian lands.
4Sales of Fossil Fuels Produced from Federal and Indian Lands, FY 2003 through FY 2013, EIA, June 2014, found at http://www.eia.gov/analysis/requests/federallands/pdf/eia-federallandsales.pdf
5Throughout this report, the term crude oil includes lease condensate.
6http://www.eia.gov/dnav/pet/pet_crd_crpdn_adc_mbblpd_a.htm.