New EIA data show total grid-connected photovoltaic solar capacity
Note: While photovoltaic capacity is typically discussed in direct-current megawatts (MWDC), EIA collects data on the electric power industry in alternating-current megawatts (MWAC). See the AC vs DC section below.
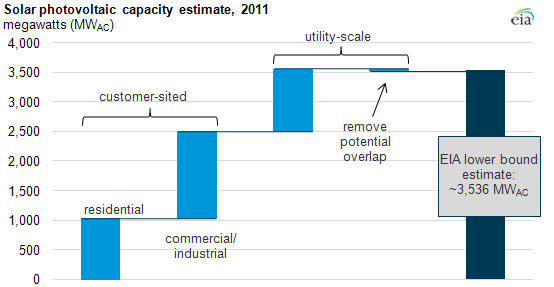
Using new information, EIA combines data on utility-scale solar photovoltaic (PV) capacity with customer-sited PV capacity, as reported in the graphic. EIA's utility-scale electric generator survey has a threshold of 1 MW for reporting and, thus, does not capture most customer-sited installations. However, in 2010, electric utilities started reporting to EIA the capacity of their customers' behind-the-meter generation, which is larger than utility-scale capacity.
National solar PV capacity is growing rapidly. Tracking this rapid growth is a challenge, however, because PV solar is more often used at a consumer's location—e.g., rooftop solar panels—and less often in large, centralized generating stations like other technologies.
An estimate of total PV capacity must therefore account for many small installations (often referred to as distributed solar capacity). However, while EIA maintains an inventory of all power plants of 1 megawatt capacity and greater, there is no census—either from government or industry—of the thousands of small rooftop commercial and residential solar PV installations across the United States.
EIA is improving its data collection to address this issue. Meanwhile, EIA presents this lower bound based on existing electric power industry survey data: at the end of 2011, EIA data show U.S. solar PV capacity was at least 3,536 megawatts (MWAC). The chart above summarizes the calculation (also, see below).
Using EIA data to estimate total PV capacity. Electric generating capacity is reported to EIA every year by:
- utility-scale power plants on the Annual Electric Generator Report (Form EIA-860)
- retail electricity providers serving net metered generators on the Annual Electric Power Industry Report (Form EIA-861).
To estimate total PV capacity, capacity data on net metered PV installations from Form EIA-861 are added to utility-scale capacity data from Form EIA-860, and then adjusted to remove possible overlap between the two data sets.
This overlap occurs because the limit for installations reported on Form EIA-861 is 2 MW, while the reporting threshold for Form EIA-860 is 1 MW. Regulatory capacity limits on the size of net metered installations vary by state; some are above the 1-MW threshold for utility-scale reporting, and some states have no limit at all. For states in either of these cases, industrial and commercial solar PV installations between 1 and 2 MW are removed from the total utility-scale capacity reported on the Form EIA-860. In 2011, this potential overlap amounted to only 14.2 MW.
Why a lower bound? It is important to emphasize that this estimate is a lower bound for total PV capacity, as there are likely PV installations that are not captured on either the Form EIA-860 or EIA-861. As mentioned above, net metering size limits vary, and some are far below the 1-MW threshold for utility-scale reporting. It is not clear that EIA is capturing PV installations with capacities above the state net metering limit but below the Form EIA-860 threshold.
At first glance, the distributed generation dataset, also collected on the Form EIA-861, might seem useful to capture this missing segment. However, the net metering data collection is similar but more comprehensive and is preferred. The reported data for net metering are larger, and the net metering collection includes residential, industrial, and commercial sectors.
Comparison to industry estimate. The Interstate Renewable Energy Council (IREC) prepares an estimate of total PV capacity developed using a combination of state incentive program data, information from utility companies, and collaboration with other organizations tracking this series. Considering the information below places the IREC 2011 estimate of 4,000 MWDC between 3,200 and 3,600 MWAC(using an 80% to 90% conversion efficiency). EIA's lower bound of 3,536 MWAC falls towards the high end of this range.
Alternating current and direct current (AC and DC). To compare EIA's lower bound with solar industry estimates, it is important to consider the units with which they are described. Organizations like IREC and the Solar Energy Industries Association report in MWDC, because solar panels produce DC power. EIA collects electric capacity data in MWAC, the type of electricity used in homes and on the grid, and which is produced by non-PV generators. Moving the electricity from the solar panel to the grid involves some losses, and equipment and other considerations differ from installation to installation.
Tags: capacity, commercial, electricity, industrial, renewables, residential, solar, utility