
EIA expects lower gasoline prices in 2026 and 2027 as crude oil prices fall
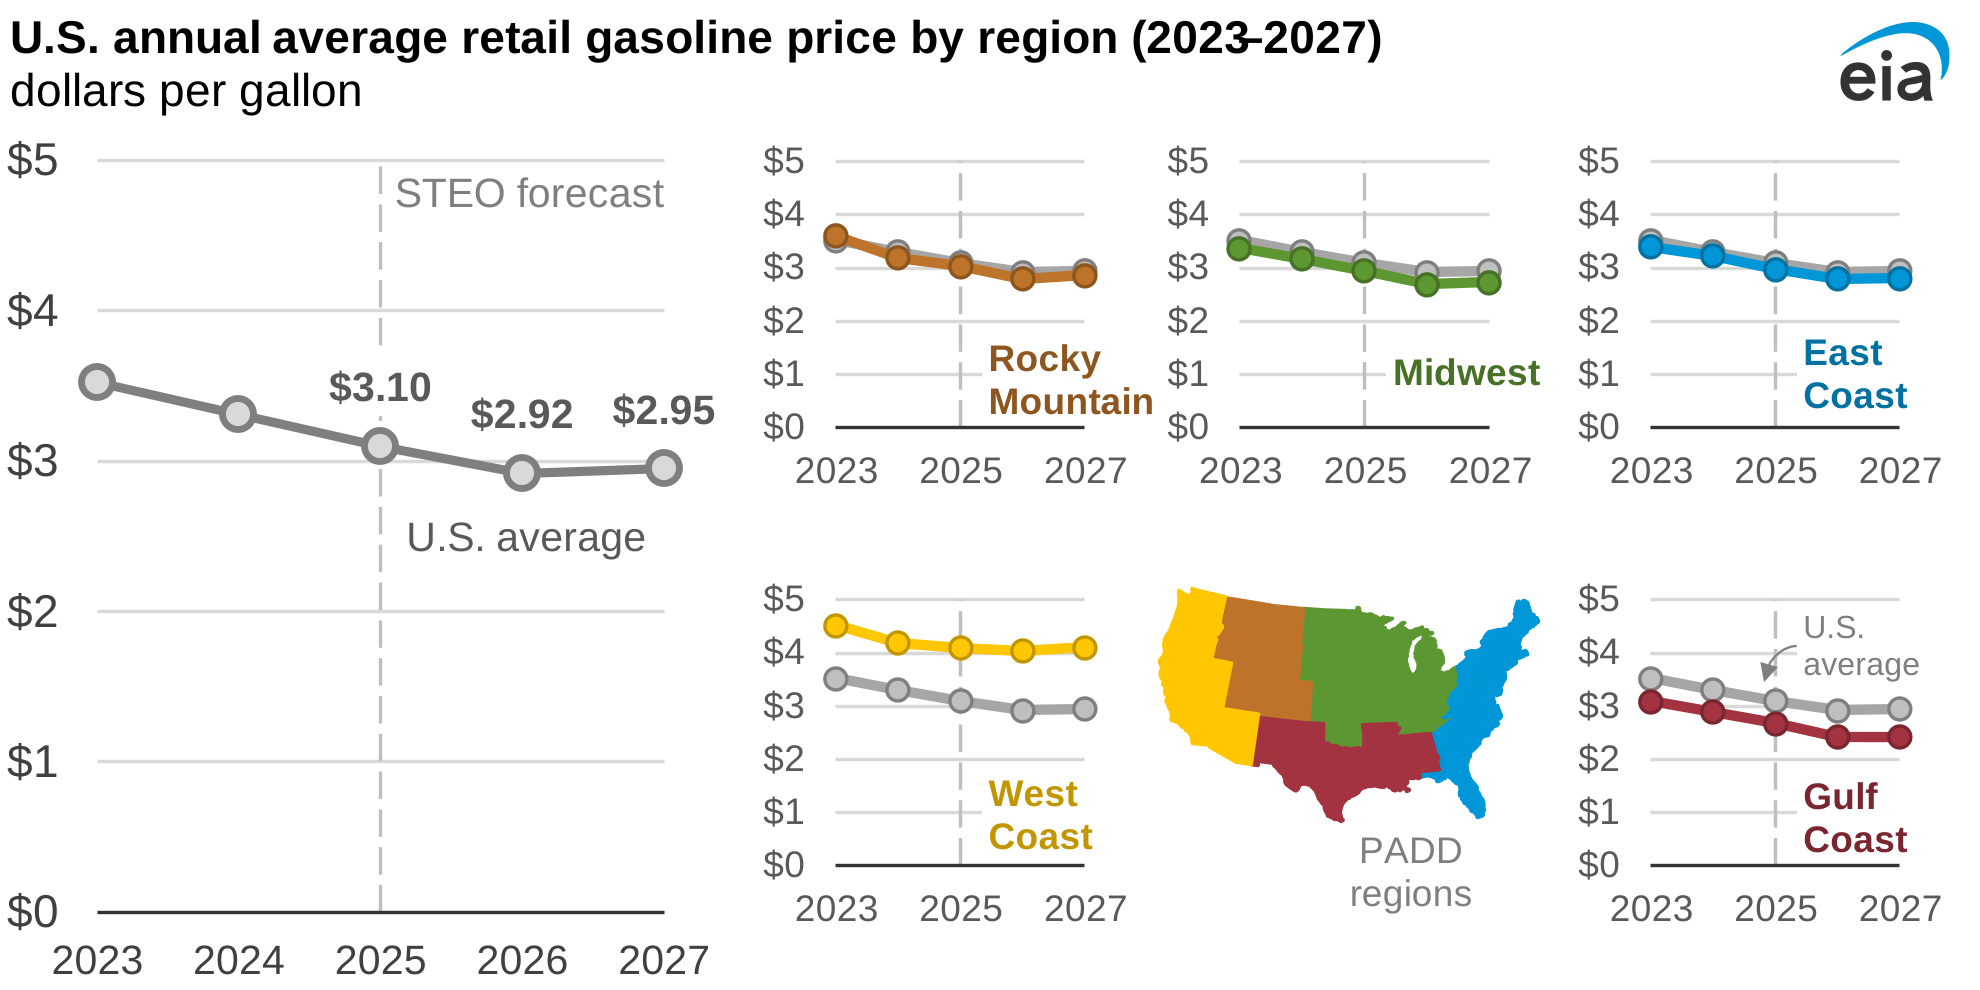
Data values: U.S. Regular Regional Motor Gasoline Prices
In our latest Short-Term Energy Outlook, we forecast retail U.S. gasoline prices will be lower the next two years than in 2025, falling 6% in 2026 and then increasing 1% in 2027. Our gasoline price forecast generally follows a similar path as global crude oil prices, but decreasing U.S. refinery capacity this year may offset some of the effects of lower crude oil prices on gasoline, especially in the West Coast region.
On a regional basis, we expect gasoline prices to decrease in every region in 2026 and increase in 2027. Despite that expected increase, 2027 average gasoline prices remain less than 2025 averages in every region except the West Coast (PADD 5), where we expect the upcoming loss of refinery capacity will contribute to relatively higher gasoline margins and gasoline prices that are about equal to 2025, in nominal terms.
The West Coast region typically has the highest gasoline prices in the country, and we expect that trend to continue through 2027. We expect the Gulf Coast region to maintain the lowest gasoline prices through the forecast, followed by the Midwest.
Our forecast for generally lower retail gasoline prices over the next two years follows an ongoing trend of falling gasoline prices since reaching a historical high point of $5/gallon in mid-2022. On a nominal basis, we estimate the 20 cents-per-gallon decrease in 2026 will be comparable to price decreases in 2024 and 2025.
The price of crude oil is the largest factor in determining U.S. retail gasoline prices. In the previous 10 years, the price of crude oil used at U.S. refineries accounted for slightly more than 50%, on average, of the retail average gasoline price. In 2026 and 2027, we expect crude oil’s contribution to the retail average gasoline price to fall below 45%, on an annual average basis. We expect global increases in crude oil supply to continue to outpace increases in demand in 2026 and for crude oil prices to fall to their lowest annual average since 2020.
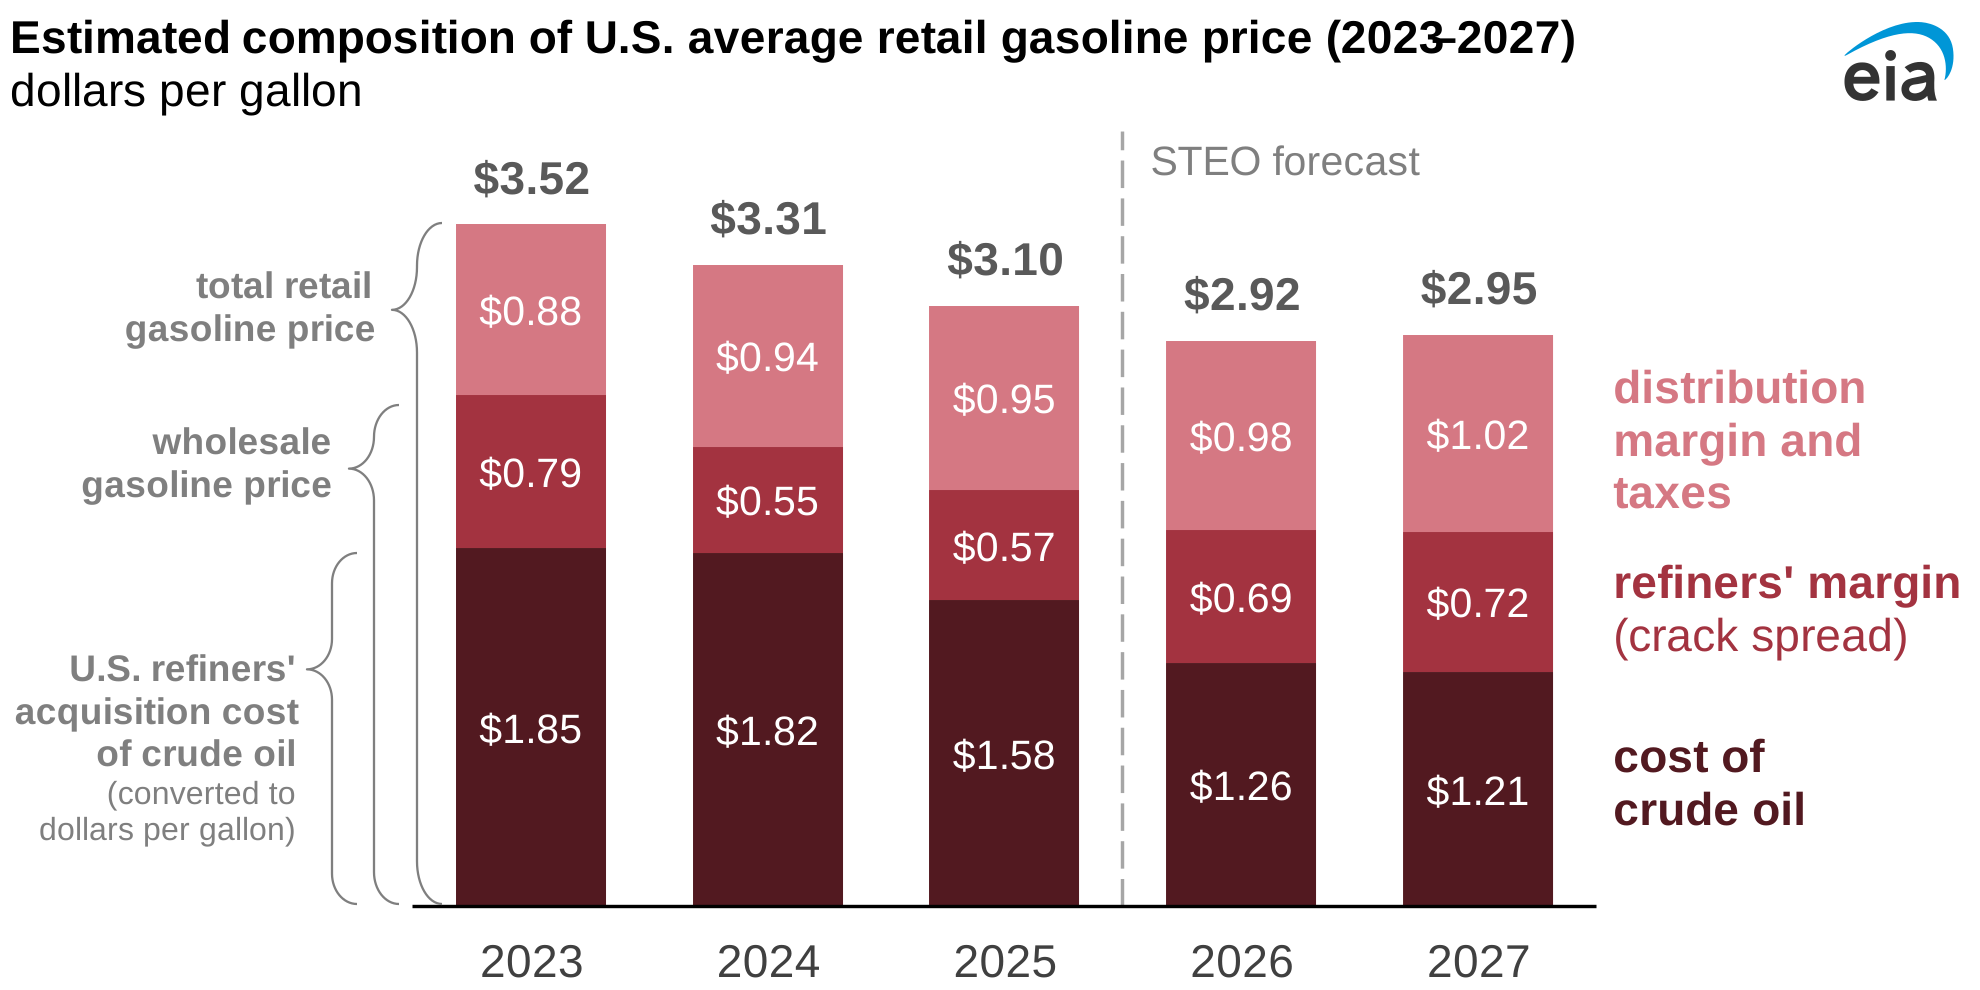
Data values: Brent Spot Average, Wholesale Gasoline Price, Regular Grade Retail Gasoline Price
In 2026, we expect crack spreads for gasoline will be more than they were in the previous two years. Crack spreads are the difference between wholesale gasoline prices and crude oil prices, which can serve as a measure of refinery profitability.
This increase in crack spreads reflects our forecast for generally lower gasoline inventories because of lower refinery production and relatively tight Atlantic Basin market conditions. Although we expect crack spreads to increase through the next two years, we still expect they will be less than gasoline crack spreads in 2022 or 2023.
Principal contributor: Kevin Hack