
Midwest refinery outages increase regional gasoline prices
A series of refinery outages in Chicago and Ohio have generally increased Midwest prices for petroleum products relative to the U.S. average, particularly gasoline. The outages reflect an unusual decline in refining activity near the end of the high-demand summer season and have drawn down regional inventories.
On July 15, ExxonMobil’s Joliet refinery outside of Chicago, with 251,800 barrels per day (b/d) of capacity, was shut down on an emergency basis in response to a power outage brought on by severe weather conditions. The shutdown took the refinery offline for several weeks before it could safely resume operations. Operators reported they had begun bringing the facility back online as of August 8, and later reports have since indicated that the Joliet facility has resumed normal operations.
In Ohio, operators also reported temporary unit shutdowns at Cenovus’s 183,000-b/d Lima and 150,800-b/d Toledo refineries. Since the week ending July 12, just before the Joliet outage, to August 9, Midwest refinery utilization decreased 11 percentage points to 86% because of the outages, reducing refinery production of gasoline, diesel, and other refined petroleum products. As these refineries reentered service, Midwest refinery utilization increased more than 10 percentage points the following week, to 97% as of August 16.

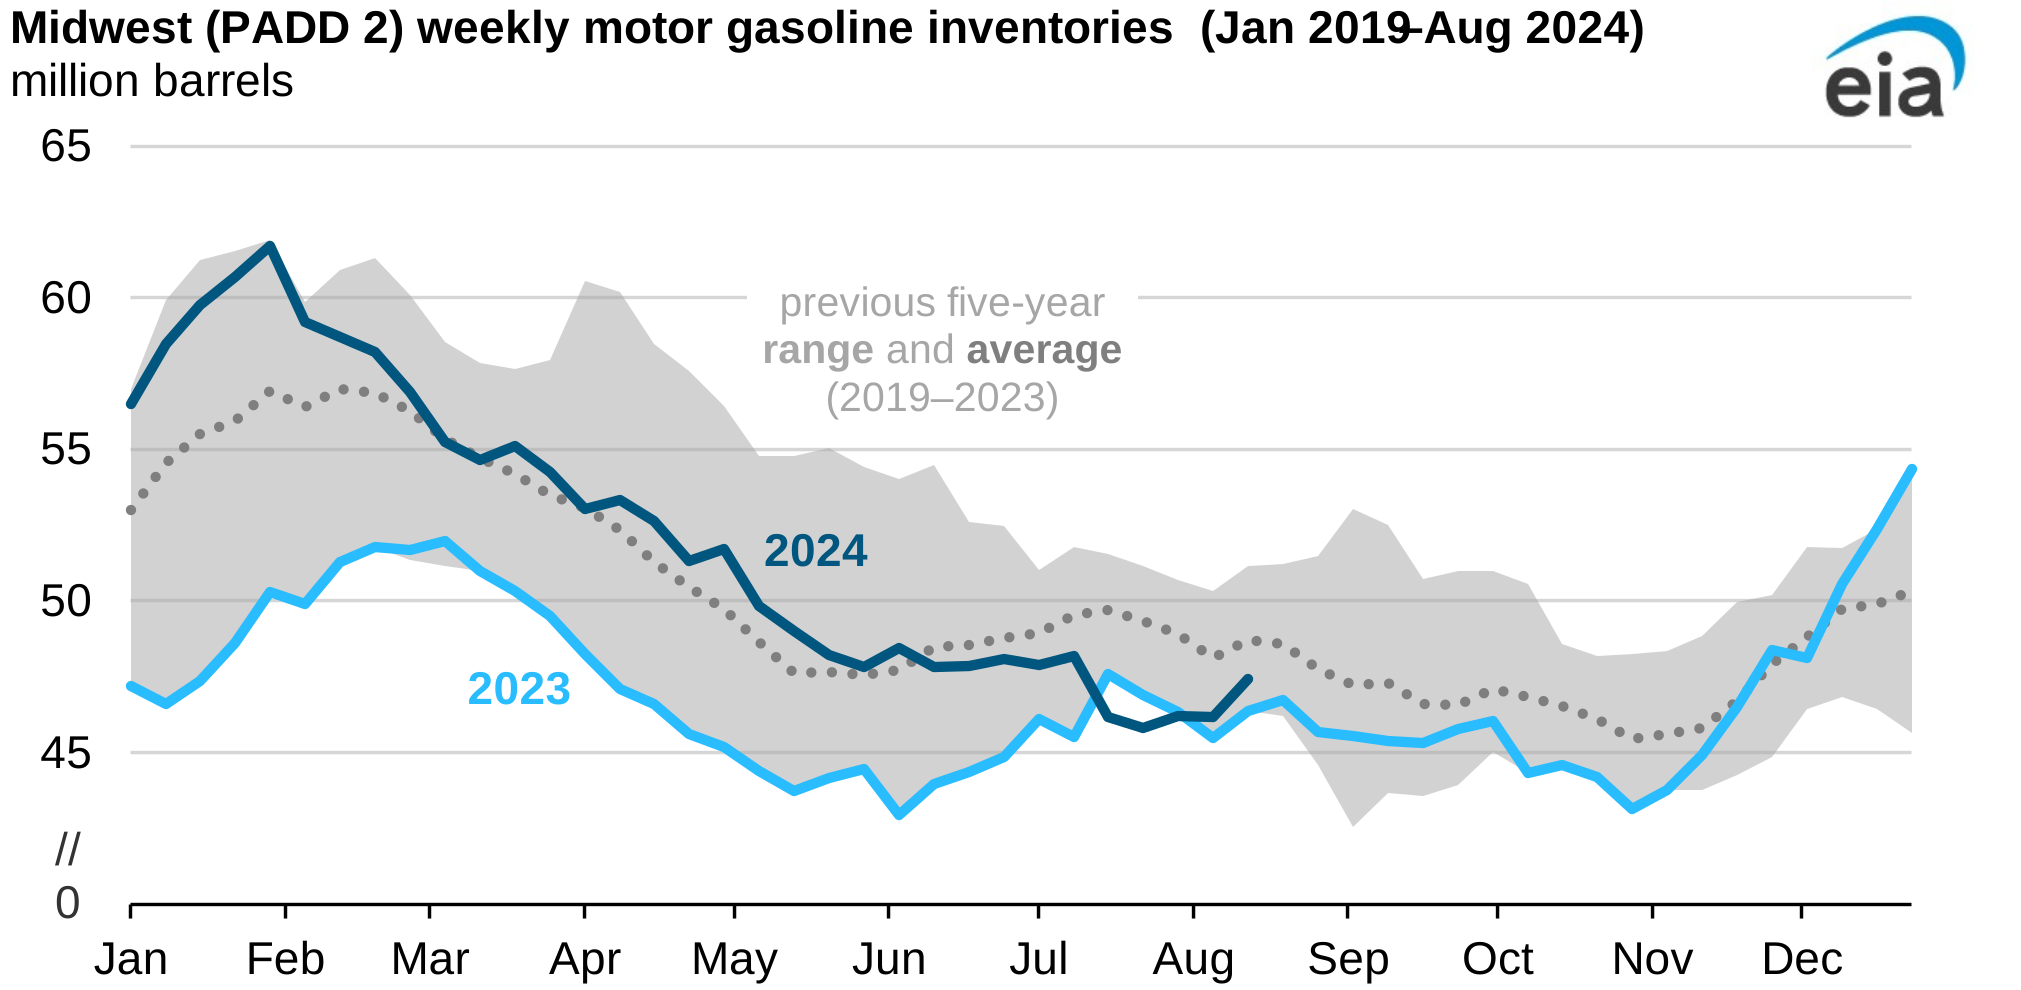
Lower refinery utilization means refineries produced less gasoline, which has resulted in noteworthy draws on Midwest gasoline inventories. In the week ending July 19, immediately after the Joliet outage began, Midwest gasoline inventories drew down by 2 million barrels, falling below 2023 levels and the five-year (2019–2023) low.
Through August 9, weekly inventory data show that Midwest gasoline inventories remained at about 46 million barrels, between 4% and 7% below the five-year average, depending on the week. The return of these refineries to service contributed to regional gasoline inventories increasing 1.3 million barrels the week of August 16. Nonetheless, below-average inventories have put pressure on Midwest gasoline prices.
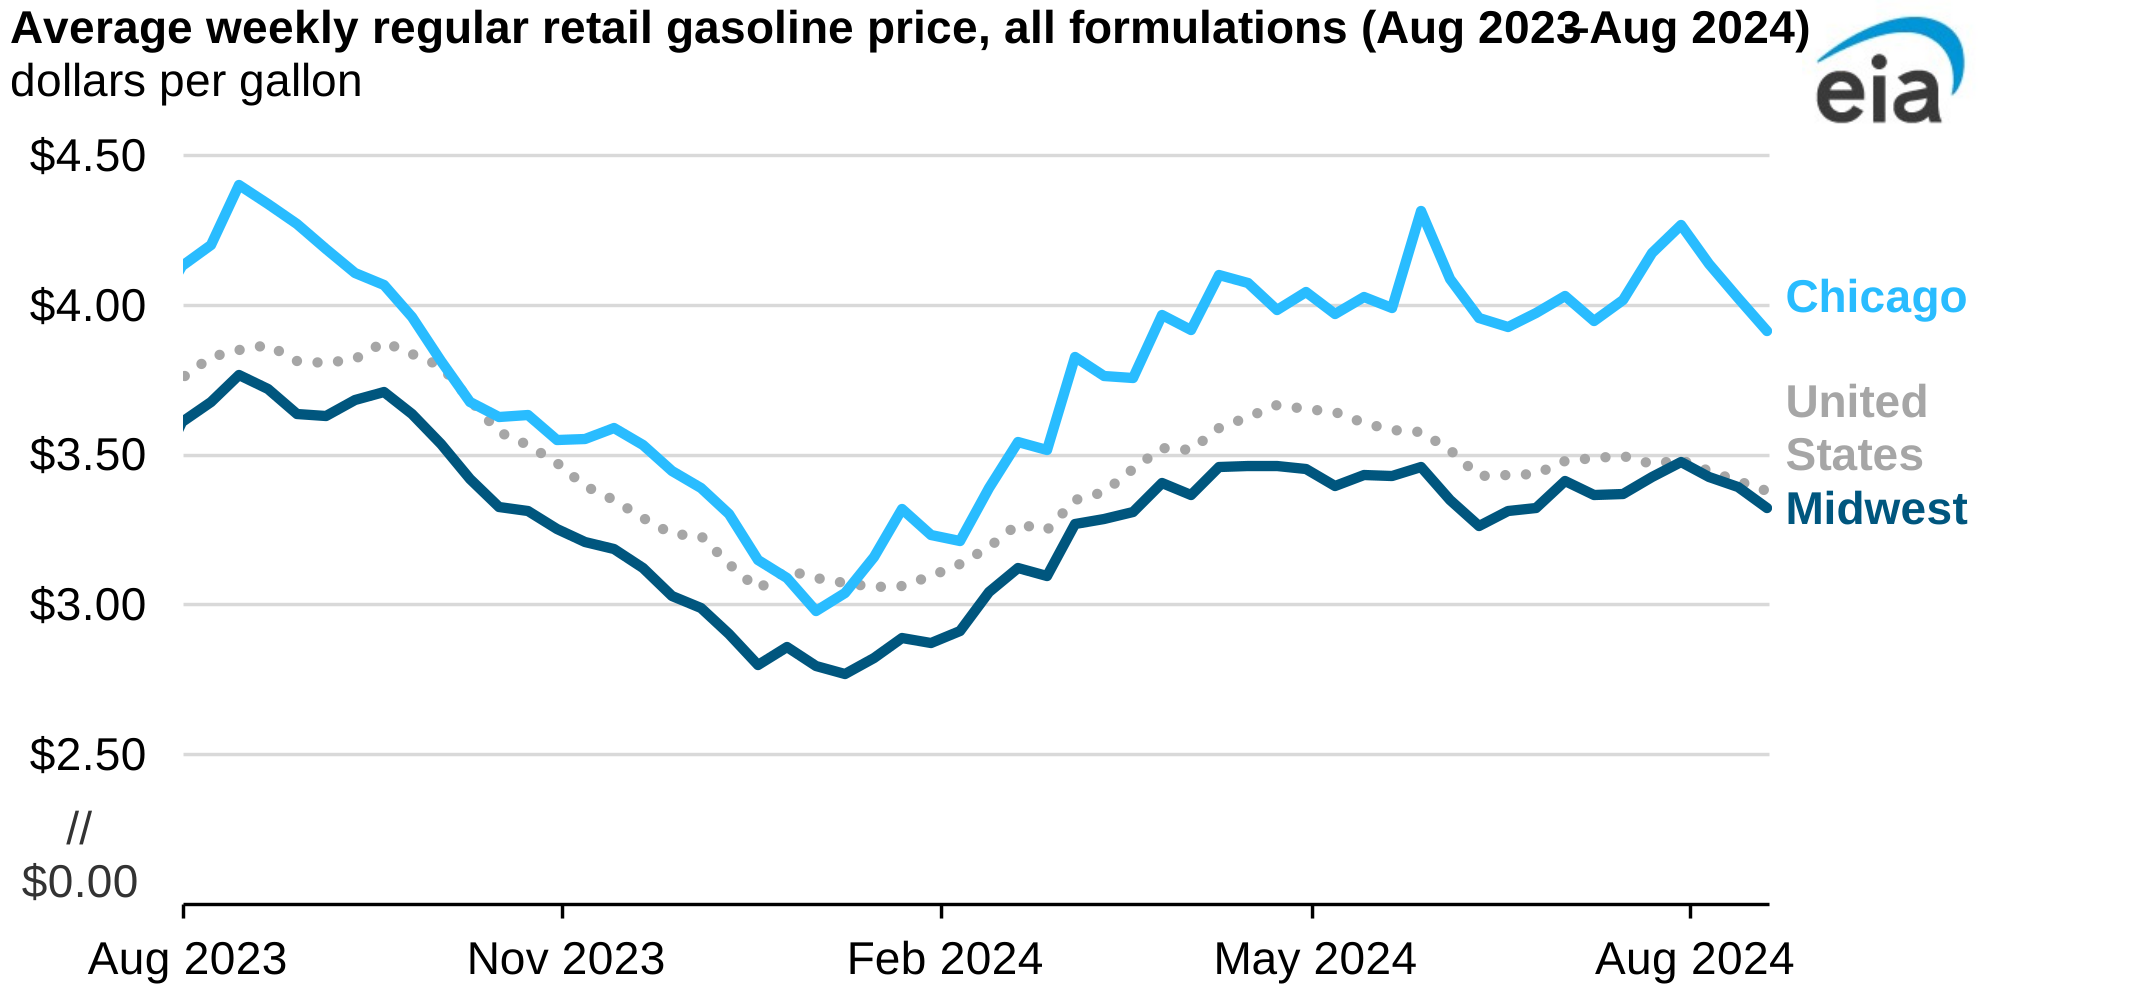
Retail gasoline prices in the Midwest are typically lower than the U.S. average because of production from local refineries and lower regional fuel taxes. However, the average retail gasoline price in the Midwest has been within 1% of the U.S. average for three consecutive weeks following the outages, according to our Gasoline and Diesel Fuel Update.
The recent retail price increase in the Midwest marks the closest the regional average retail price has been to the national average since November 2022. In Chicago, where the impact of the refinery outages is even more pronounced, average retail gasoline prices were more than 20% higher than the U.S. average for the three-week period from July 22 to August 5. On July 29, Chicago retail prices averaged 23% higher than the U.S. average retail price, the largest percentage price premium for the city in any week since 2015.
Principal contributor: Kevin Hack
Tags: prices, refineries, gasoline, Midwest, outages, petroleum products