
Second-quarter U.S. gasoline consumption has been less than during 2021
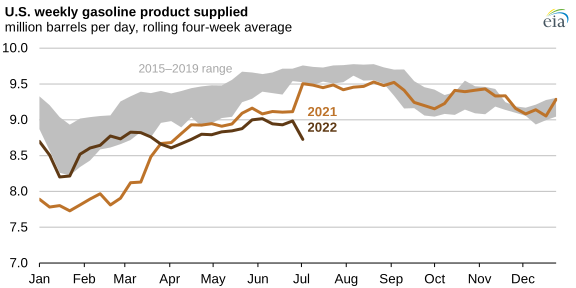
Based on weekly estimates in our Weekly Petroleum Status Report (WPSR), less gasoline has been consumed in the United States during the second quarter of 2022 and early July than during the same period in 2021. Our latest Petroleum Supply Monthly (PSM) confirms the trend, which shows that U.S. gasoline consumption (measured as product supplied) averaged 8.8 million barrels per day (b/d) this April, or 0.4% less than during April 2021.
Four primary factors affect gasoline consumption:
- The amount of travel
- Non-farm employment
- Vehicle fuel efficiency
- Gasoline prices
Typically, increases in travel and non-farm employment contribute to increases in gasoline consumption, and improvements in vehicle efficiency and higher gasoline prices contribute to decreases in gasoline consumption.
Data from the U.S. Department of Transportation show 1.6% more vehicle miles traveled (a measure of travel by vehicles) during April 2022 compared with April 2021. Increased travel tends to result in more gasoline consumption; however, increased fuel efficiency in vehicles allows drivers to travel more miles using less gasoline and can offset the increased travel.
We estimate that vehicle efficiency improved in the United States by an average of 2% more miles per gallon in April 2022 than in April 2021, suggesting that increased efficiency may have offset increased travel and led to an overall year-over-year decline in gasoline consumption. The U.S. average of vehicle miles per gallon has increased 15% since 2007 from an average of 21.3 miles per gallon to an estimated 24.4 miles per gallon during the second quarter of 2022.
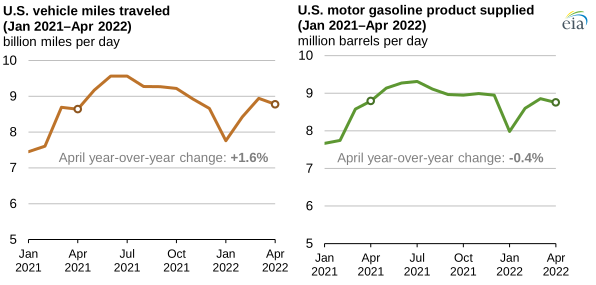
Higher gasoline prices, which were up 61% in June 2022 compared with June 2021, may have resulted in less travel during the month, although changes in gasoline prices have historically had comparatively little effect on consumption in the short term.
We estimate that if gasoline prices were to double over a given period, gasoline consumption would decrease 2%–4% over the same period. The U.S. retail price of regular gasoline averaged $5.01 per gallon (gal) on June 13, the highest inflation-adjusted (real) price for any week since 2011. Although prices as of July 11 declined to an average of $4.65/gal, they remain significantly higher than in recent years.
Principal contributor: Jeff Barron
Tags: consumption/demand, gasoline, liquid fuels