
Northwest hydroelectric output above five-year range for much of 2011
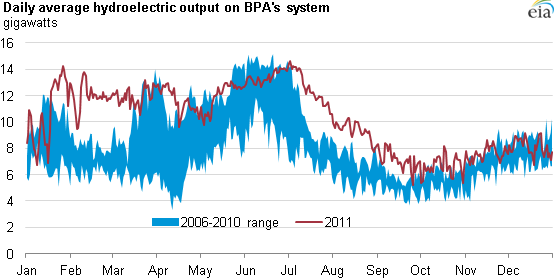
The 2011 hydro season began earlier and lasted significantly longer than in recent years, well into the summer months (see chart above). Hydroelectric generation in the Pacific Northwest is typically highest in the late winter and spring when river flows are high because of snowpack melt. This low-cost energy contributed to an average 18% decline in wholesale electricity prices compared to prices in 2010 at Mid-Columbia, a major Northwest wholesale pricing hub near the Washington-Oregon border (see chart below).
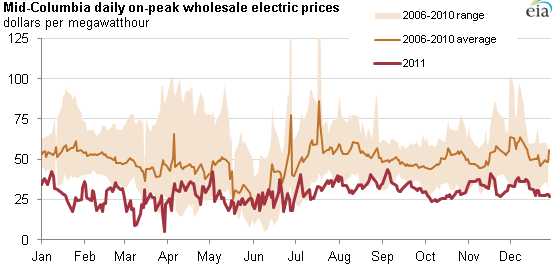
Although electricity prices were lower in 2011 compared to 2010 in much of the country, the drop in the price at Mid-Columbia was striking. Prices were near multi-year lows throughout most of 2011. Further, the increased hydroelectric output also lowered prices at major electric power hubs in California, as significant levels of power flowed throughout the Western Interconnection. An unusual combination of warm and wet weather in the second half of January and early February melted low-elevation snow, filling hydroelectric dam reservoirs on the Columbia and Snake Rivers. The increased precipitation and high water levels at reservoir dams resulted in high hydro generation.

The Pacific Northwest has enormous hydroelectric capacity, and the variable cost of producing electricity from this capacity is minimal because there is no fuel cost. Consequently, when the water flow is available to generate large amounts of hydro power, wholesale electricity prices drop. But peak water flow is typically a seasonal event driven by snowpack melt, so the price-reducing effect of hydropower normally lasts only a few months each year, typically in the spring and early summer.
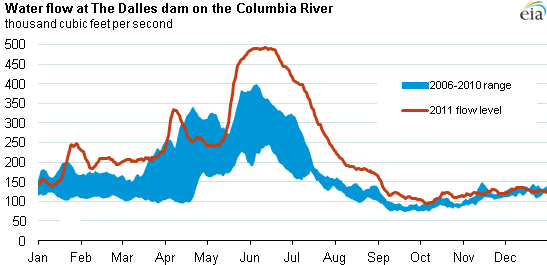
However, in 2011 high water flows persisted through the summer, as illustrated by the water flow at The Dalles dam on the Columbia River, a centrally located run-of-river hydroelectric plant (see chart above). The difference in 2011 was the persistent rainfall throughout the late spring and summer, prolonging the hydro season well into the summer months and driving down wholesale power prices.
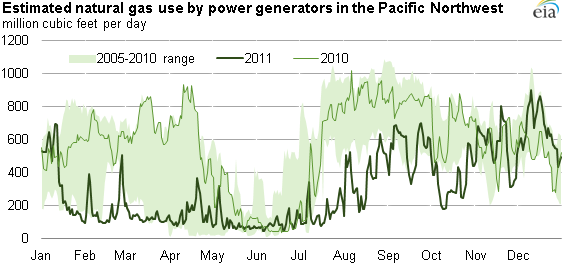
Abundant hydroelectric supply also crowded out natural gas-fired generation compared to 2010 and previous years. Natural gas generation, for example, dropped almost to zero during the third week of May. In 2011, natural gas use for power generation in the Pacific Northwest was down 46%, or an annual average of 260 million cubic feet per day, relative to 2010 levels (see chart below). Other thermal electric power plants as well as wind generators in the region also curtailed supply in favor of hydroelectric generation.
Tags: electricity, generation, hydroelectric, natural gas, Northwest, Oregon, prices, states, Washington