
Monthly U.S. energy-related CO2 emissions in April were the lowest in decades
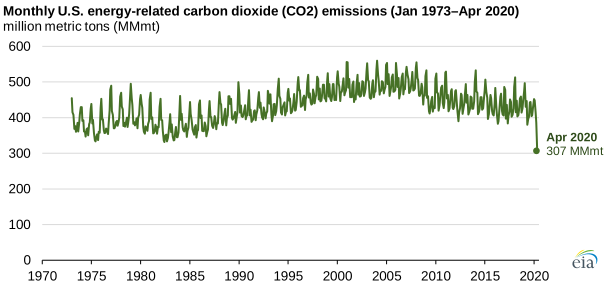
Monthly U.S. energy-related carbon dioxide (CO2) emissions fell to 307 million metric tons (MMmt) in April 2020, the lowest value in the U.S. Energy Information Administration’s (EIA) monthly series for CO2 emissions, which dates back to 1973. Travel restrictions and other measures to mitigate the spread of coronavirus in April resulted in sudden and significant changes in energy consumption, resulting in lower energy-related emissions.
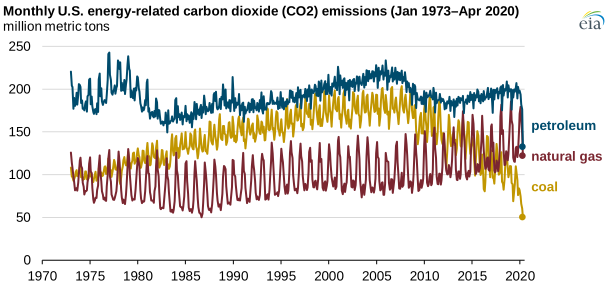
Changes in U.S. energy-related CO2 emissions in April largely mirror the changes in energy consumption described in previous Today in Energy articles: a sudden drop in petroleum consumption, shifts in electricity consumption from the commercial and industrial sectors to the residential sector (and lower overall electricity use), and relatively smaller changes in natural gas consumption across sectors. More than 99% of energy-related CO2 emissions come from the consumption of fossil fuels: petroleum, coal, and natural gas.
From March to April 2020, CO2 emissions from petroleum consumption decreased 25%, and CO2 emissions from coal consumption decreased 16%. Both changes resulted in the lowest monthly CO2 emission values on record for those fuels. Despite the 25% decline in petroleum-related CO2 emissions, the United States still emitted more CO2 from petroleum (133 MMmt) in April than from natural gas (122 MMmt) or coal (51 MMmt).
Energy-related CO2 emissions from natural gas consumption decreased 17% between March and April 2020. However, unlike CO2 emissions from petroleum and coal, which reached record lows, CO2 emissions from natural gas in April 2020 were 22% greater than the previous April, largely because natural gas-fired power plants gained market share in the U.S. electric power sector.
The largest decreases in CO2 emissions in April occurred in the transportation sector. Consumer responses to the coronavirus, stay-at-home orders, and other travel restrictions that were in place throughout the country in April reduced consumption of motor gasoline (the most-consumed petroleum fuel in the United States) and jet fuel (the third-most consumed petroleum fuel).
CO2 emissions from motor gasoline consumption, which accounted for 57% of transportation sector emissions in 2019, fell to a record-low 59 MMmt of CO2 in April 2020. CO2 emissions from jet fuel, which accounted for 13% of 2019 U.S. transportation-sector emissions, also fell to a record low in April 2020.
U.S. electric power sector CO2 emissions in April 2020 also decreased to the lowest monthly levels on record. Total electricity generation was 7% lower in April 2020 than in April 2019, but energy-related CO2 emissions were 16% lower. As coal-fired power plants have retired or been used less often, a larger share of electricity generation has been coming from lower-emitting combined-cycle natural gas-fired power plants, as well as power plants fueled by nuclear, solar, and wind, which do not emit any CO2 as they generate electricity.
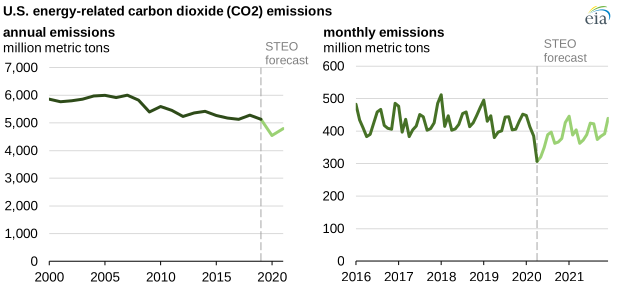
In the August 2020 Short-Term Energy Outlook, EIA estimated that U.S. energy-related CO2 emissions reached their lowest level for the year 2020 in April and that forecast emissions will generally increase through the remainder of the year. On an annual basis, EIA expects that U.S. energy-related CO2 emissions will total 4,543 MMmt in 2020, or 11% lower than their 2019 level. EIA expects energy-related CO2 emissions in 2021 to increase to 4,798 MMmt, or 6% lower than their 2019 level.
Principal contributor: Bill Sanchez
Tags: emissions, CO2 (carbon dioxide)