
Drop in petroleum demand led to rise in crude oil inventories and low refinery utilization
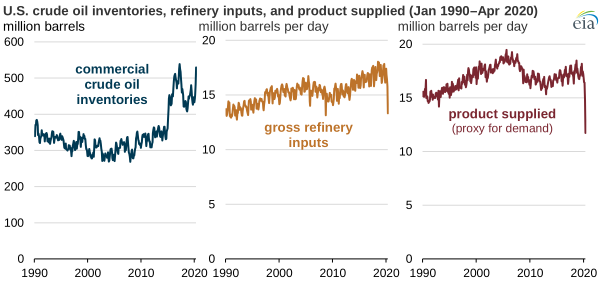
The U.S. Energy Information Administration’s (EIA) latest Petroleum Supply Monthly shows the significant changes in petroleum markets that occurred in April, when most of the United States was under stay-at-home orders to limit the spread of coronavirus. In April, commercial crude oil inventories increased by 46.7 million barrels (10%)—the largest monthly increase in EIA data going back to 1920. U.S. refineries operated at 70% of their capacity, the lowest utilization rate in EIA’s monthly data series dating back to 1985. Demand for finished petroleum products fell to 11.7 million barrels per day (b/d), the lowest level since at least 1981.
April’s crude oil inventory increase is a result of refinery runs falling more quickly than crude oil supply, which is determined by domestic production and imports. U.S. crude oil production in April averaged 12.1 million b/d, a decrease of 669,000 b/d (5%) from March. This decrease represents the largest month-over-month decline since September 2008, when Hurricanes Ike and Gustav hit the U.S. Gulf Coast. U.S. crude oil imports fell by 776,000 b/d (12%) from March to April, further decreasing crude oil supply in the United States.
The combined drop in production and imports was smaller than the decline in gross inputs to refineries, resulting in record increases in crude oil inventories. Based on estimates in EIA’s Weekly Petroleum Status Report, commercial crude oil inventories reached a record high of 541 million barrels in the week ending June 19 and have fallen slightly in the weeks since then.
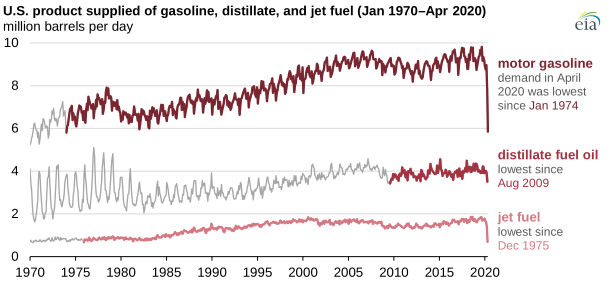
Changes in travel patterns resulted in the lowest levels of U.S. demand for finished petroleum products (as measured by product supplied) in decades. Transportation fuels have been affected differently by changes in travel: demand for jet fuel and motor gasoline fell much more than distillate fuel, which is primarily consumed as diesel. From March to April, product supplied of finished motor gasoline decreased a record 1.9 million b/d (25%) to 5.9 million b/d, the lowest monthly value since the mid-1970s.
In the span of two months, U.S. demand for jet fuel fell by more than half, from 1.6 million b/d in February to 691,000 b/d in April. Before April, U.S. jet fuel demand had not been less than 700,000 b/d since the mid-1970s.
Distillate demand fell by 408,000 b/d, or about 10%, from March to April. Although the change in distillate demand was less drastic than the changes in motor gasoline and jet fuel demand, distillate consumption in April 2020 was the lowest in more than a decade.
Principal contributors: Matt French, Jimmy Troderman