
U.S. crude oil and natural gas production in April had biggest monthly decreases in years
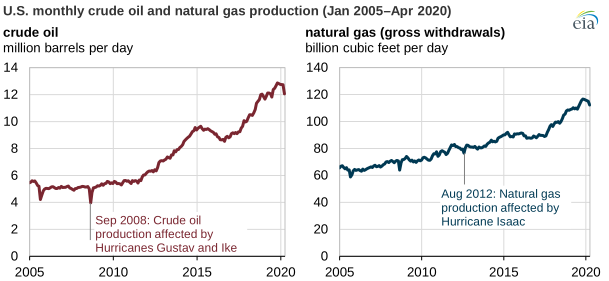
Production of crude oil and natural gas decreased in the United States in April 2020 by 670,000 barrels per day (b/d) and 2.6 billion cubic feet per day (Bcf/d), respectively, according to the U.S. Energy Information Administration’s (EIA) Monthly Crude Oil and Natural Gas Production Report. Production declines of that magnitude usually arise only in natural disasters such as hurricanes: the drop in U.S. crude oil production in April was the largest since September 2008 when Hurricanes Gustav and Ike caused production to fall by 1.03 million b/d. The April 2020 decline in natural gas production was the largest monthly decrease since Hurricane Isaac-related shut-ins in August 2012.
April was the first full month to be affected by the low crude oil and natural gas prices related to the sudden drop in petroleum demand associated with coronavirus (COVID-19) mitigation efforts. The declining market led oil and natural gas operators to shut-in wells and limit the number of wells brought online, lowering the output for the major oil- and natural gas-producing regions.
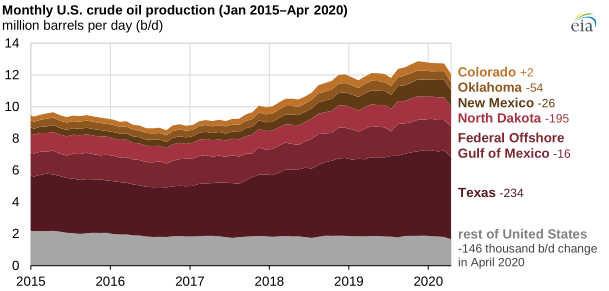
U.S. crude oil production decreased by 5.3% in April, and several states and regions reported declines. Texas saw the largest crude oil production decrease of 234,000 b/d (-4.3%) from March to April 2020. More crude oil is produced in Texas than in any other state or region of the United States, accounting for 41% of the national total in 2019.
North Dakota saw the second-largest decrease, 195,000 b/d, or 13.8%. Both Texas and North Dakota noted their largest recorded monthly decreases. Of the top six crude oil-producing states, Colorado was the only state to record an increase in April as a result of more new wells coming online than were shut-in.
The U.S. Energy Information Administration (EIA) expects U.S. crude oil production to fall in 2020 as efforts to mitigate the spread of COVID-19 continue to result in a steep drop in demand for petroleum products and lower oil prices. EIA expects crude oil prices will average $40 per barrel (b) for the first half of 2020 and will average $39/b in the second half of 2020. In its July Short-Term Energy Outlook (STEO), EIA forecasts that U.S. crude oil production will average 11.6 million barrels per day (b/d) in 2020. These levels would be 0.6 million b/d lower than the 2019 average of 12.2 million b/d.
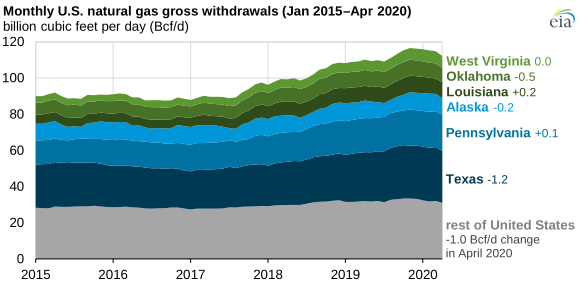
U.S. natural gas production decreased by a lesser percentage than crude oil production in April, down only 2.3%. Texas also saw the largest monthly decrease for natural gas production in April, decreasing by 1.2 Bcf/d, or 4%. Oklahoma had the second-largest decrease at 0.5 Bcf/d, or 6%. Louisiana and Pennsylvania recorded production increases for April.
EIA forecasts that U.S. marketed natural gas production—which it defines as gross withdrawals of natural gas less natural gas used for repressuring reservoirs, quantities vented or flared, and nonhydrocarbon gases removed in treating or processing operations—will continue to decline for the remainder of 2020. EIA forecasts that U.S. marketed natural gas production will average 96 Bcf/d in 2020, down from 99 Bcf/d in 2019.
Principal contributor: Emily Geary