
U.S. crude oil production efficiency continues year-over-year improvements
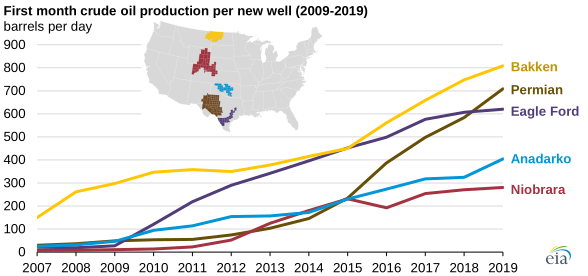
U.S. oil production from tight formations increased in 2019, accounting for 64% of total U.S. crude oil production. This share grew because of the increasing productivity of new wells that were brought online during 2019. Since 2007, the average first full month of oil production from new wells in regions tracked by the U.S. Energy Information Administration’s (EIA) Drilling Productivity Report (DPR) has increased. The growing initial production rates have helped oil production from tight formations to increase despite the slowdowns in drilling activity when oil prices fell between 2015 and 2016. Since 2017, recovering oil prices and more efficient production from new wells have helped producers cover costs of drilling, production, and the development of new technologies.
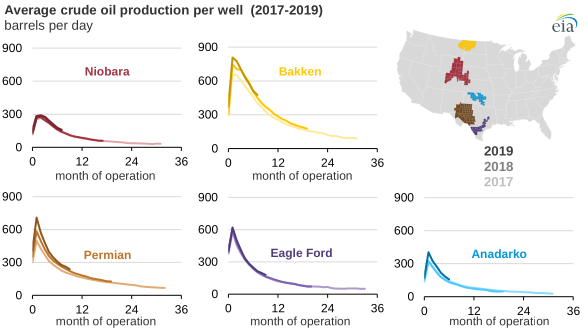
The average new well in each DPR region produced more oil in 2019 than wells drilled in previous years in those same regions. This trend has persisted for more than 10 consecutive years. More effective drilling techniques, including the increasing prevalence of hydraulic fracturing and horizontal drilling, have helped to increase these initial production rates. In particular, well productivity was improved because of the injection of more proppant during the hydraulic fracturing process and the ability to drill longer horizontal components (also known as laterals) and perforate more stages.
Increasing well productivity has supported crude oil production even in years such as 2015, when oil prices fell and rig counts dropped. In 2016, rig counts continued to decline sharply, and total U.S. crude oil production decreased for the first time in 10 years. Fewer wells were drilled; however, those that were drilled were drilled more quickly and located in more productive areas, which led to increasing per-well production.
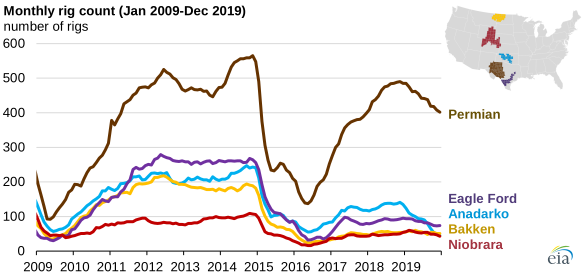
Rig counts have fluctuated throughout 2019 in all DPR regions. The aggregate rig counts declined 16% in the first 11 months of 2019. Despite the decrease in rig count, producers are capable of drilling more efficient wells faster to keep U.S. crude oil production growing.
Oil producers have increasingly targeted the Permian region, which spans parts of western Texas and eastern New Mexico. The geological structure in the Permian region is more complicated than in other regions, and it took producers more time to advance the drilling and completion technology in the region. However, the Permian region is larger and has more potential for oil production than other regions. Total production and production per new well have increased in the Permian region for 13 consecutive years. In the other four DPR oil regions, oil production fell from 2016 to 2017 because of low oil prices. In Eagle Ford, oil production in 2019 is still lower than its peak in 2015.
Principal contributors: Jozef Lieskovsky, Richard Yan