Hydraulically fractured horizontal wells account for most new oil and natural gas wells
From December 17 through December 31, Today in Energy will feature a selection of our favorite articles from 2018. Today’s article was originally published on January 30. Production by well type was examined in a later article.
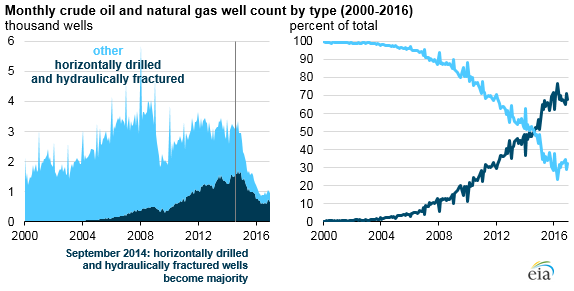
In 2016, hydraulically fractured horizontal wells accounted for 69% of all oil and natural gas wells drilled in the United States and 83% of the total linear footage drilled. The combination of horizontal drilling and hydraulic fracturing has increased the rate of recent U.S. crude oil, lease condensate, and natural gas production.
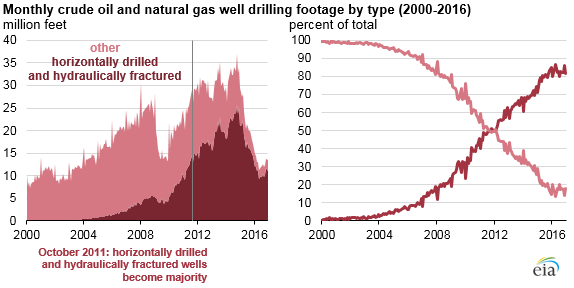
Hydraulically fractured horizontal wells became the predominant method of new U.S. crude oil and natural gas development in October 2011, when total footage (in linear feet) surpassed all other drilling and completion techniques. The combination of horizontal drilling and hydraulically fracturing has contributed to increases in crude oil and natural gas production in the United States, which are both expected to reach record levels in 2018.
Although horizontal drilling has been used for nearly a century, its use as a source of U.S. oil and natural gas production began growing in the early 2000s. The process involves drilling a well vertically to a certain depth and then bending the path of the drilling until it extends horizontally. Because they are longer, and the drilling process is more complex, a horizontal well is generally more expensive to drill than a vertical well, but it is expected to produce more crude oil and natural gas.
Horizontal drilling allows more of the wellbore to remain in contact with the producing formation, increasing the amount of oil or natural gas that can be recovered. This method also results in horizontal wells having more drilled footage than vertical wells—hence total footage drilled using horizontal drilling techniques surpassed vertical footage before the actual number of horizontal wells surpassed the number of vertical wells.
In 2016, total drilled footage reached nearly 13 million feet, about 10.7 million of which were hydraulically fractured and horizontally drilled. The length of the horizontal section, or lateral, can range from a few hundred feet to several miles.
Hydraulically fractured horizontal wells have accounted for most of all new wells drilled and completed since late 2014. As of 2016, about 670,000 of the 977,000 producing wells were hydraulically fractured and horizontally drilled.
Hydraulic fracturing is a completion technique, meaning it is performed after the oil or natural gas well has been drilled. Like horizontal drilling, this technique has been practiced for many years, but it has only recently become a major part of U.S. production in combination with horizontal drilling.
Hydraulic fracturing involves forcing a liquid under high pressure from a wellbore against a rock formation until it fractures. The injected fluid contains a proppant—small, solid particles, usually sand or a man-made granular solid of similar size—that wedges open the expanding fractures. The proppant keeps the fracture open, allowing hydrocarbons such as crude oil and natural gas to flow more easily from the additional surface area to the rock formation provided by the fractures back to the wellbore (the drilled hole) and then to the surface.
Principal contributors: Troy Cook, Jack Perrin, Dana Van Wagener
Tags: crude oil, drilling, liquid fuels, natural gas, wells