
U.S. crude oil exports increased following hurricane-related refinery disruptions
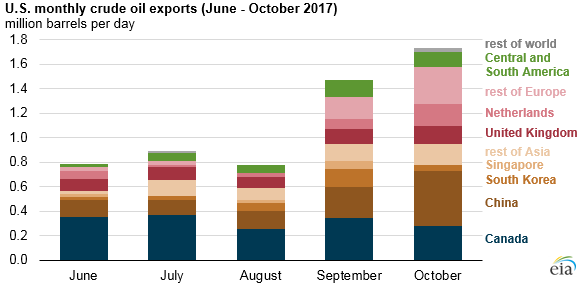
From late August through September 2017, Hurricane Harvey caused disruptions to the U.S. Gulf Coast refining sector, resulting in record-high U.S. crude oil exports when export facilities reopened after the storm and before many refineries returned to pre-storm levels of utilization. In October 2017, crude oil exports from the United States reached a monthly record of more than 1.7 million barrels per day (b/d). EIA’s Petroleum Supply Monthly data for October 2017 show that the largest increases in U.S. crude oil exports were to Asia, followed by Europe.
Exports to Asian countries accounted for 35% of total U.S. exports of crude oil in the first eight months of 2017, averaging 312,000 b/d. In September and October, exports to Asia accounted for 40% of total U.S. exports of crude oil, averaging 636,000 b/d, or more than double their pre-Harvey levels.
Similarly, exports to European countries accounted for 22% of total U.S. exports of crude oil in the first eight months of 2017, averaging 193,000 b/d. In September and October, exports to Europe averaged 510,000 b/d, which accounted for 31% of U.S. exports of crude oil.
In previous years, Canada received most of the U.S. crude oil exports because it was exempt from restrictions on exporting U.S. crude oil. When certain restrictions on U.S. crude oil exports were lifted in December 2015, U.S. exports of crude oil increased and began reaching more destinations.
Aside from Canada, countries in Asia and Europe have been some of the largest recipients of U.S. crude oil since the restrictions were lifted. However, because of the way U.S. Customs and Border Protection export data are reported, some nations listed as receiving crude oil exports from the United States in EIA statistics, such as Singapore and Netherlands, may not be final destinations.
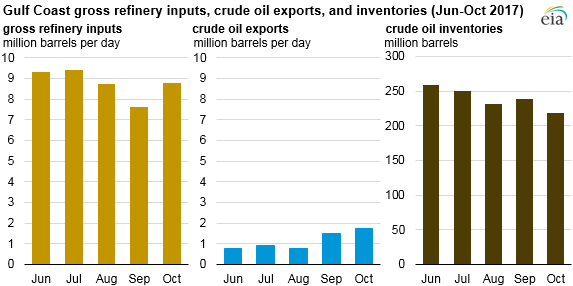
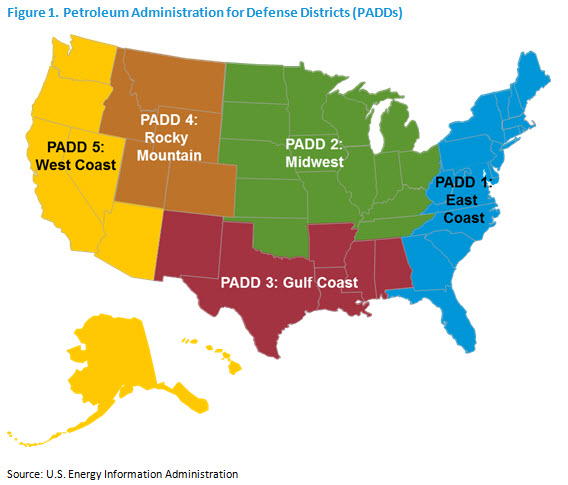
Many refineries in the U.S. Gulf Coast (defined as Petroleum Administration for Defense District 3) either reduced operations or shut down leading up to or in the immediate aftermath of the hurricane. From August through September, gross inputs to refineries in the Gulf Coast region fell by 1.1 million barrels per day (b/d), a 13% decrease. Over the same period, regional crude oil inventories increased by 6.9 million barrels.
Although many export facilities in the Gulf Coast reduced operations or shut down because of Harvey, export facilities returned to operation following the hurricane faster than refineries. Exports of crude oil in August were the second lowest for 2017 at 772,000 b/d, but in September they reached a then-record high of 1.5 million b/d, most of which went to Asian markets. Inputs to refineries in the Gulf Coast region began reaching pre-Harvey levels in October.
With Gulf Coast refinery runs back to pre-Harvey levels and exports of crude oil reaching another record high in October of 1.7 million b/d, Gulf Coast crude oil inventories registered a draw of 19.9 million barrels. Most crude oil exports in October also went to Asia, providing evidence that the marginal competitive market for U.S. crude oil is Asia. According to data in EIA’s Weekly Petroleum Status Report, from late October through the end of 2017, exports of crude oil and inputs to Gulf Coast refineries remained relatively high, resulting in a continued decrease in Gulf Coast crude oil inventories.
Principal contributor: Corrina Ricker
Tags: crude oil, exports/imports, Gulf Coast, liquid fuels, refineries