Intensity of U.S. energy use in manufacturing decreases as output outpaces fuel use
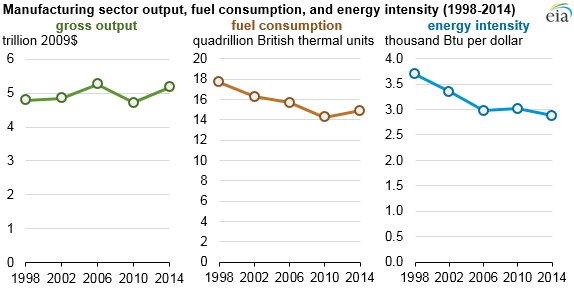
The energy intensity of U.S. manufacturing has continued to decrease, according to the latest data from EIA’s Manufacturing Energy Consumption Survey (MECS). From 2010 to 2014, manufacturing fuel consumption increased by 4.7%, while real gross output increased by 9.6%—or more than twice that rate—resulting in a 4.4% decrease in energy intensity.
Like EIA’s consumption surveys of the residential and commercial sectors, MECS is conducted on a periodic basis. The latest MECS release provides manufacturing energy consumption, energy expenditures, and other energy-related metrics based on data collected in 2015, which reflects activity in 2014. The U.S. Energy Information Administration has conducted the MECS survey eight times since the initial MECS survey in 1985. The 2014 MECS sample size of approximately 15,000 establishments was drawn from a sample frame representing 97% to 98% of the national manufacturing payroll.
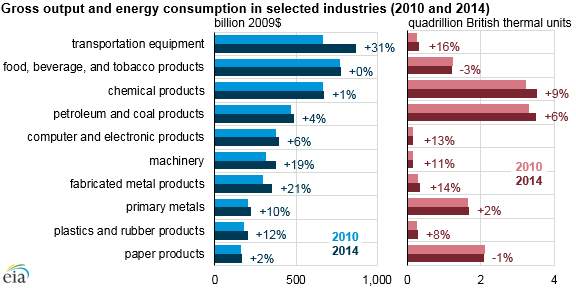
Although many manufacturing establishments are taking steps to reduce their energy consumption, the energy intensity decrease for total manufacturing is mostly the result of a shift of manufacturing output from energy-intensive industries, such as the manufacture of metals, chemicals, paper, and petroleum and coal products, to less energy-intensive industries. If major industries had maintained the same proportions of the manufacturing sector, the energy intensity decline between 2010 and 2014 would have been 0.7% instead of 4.4%.
One of the fastest growing industries between 2010 and 2014 was transportation equipment manufacturing, an industry with relatively low energy intensity. Gross output in transportation equipment manufacturing grew 30.8% over that period, much faster than the 9.6% increase in overall manufacturing output between 2010 and 2014.
While output and consumption rose, manufacturing employment decreased from 2010 to 2014, yielding an increase in labor productivity. Manufacturing processes continue to evolve, incorporating more electronic and robotic devices, which may be a primary factor in increased labor productivity.
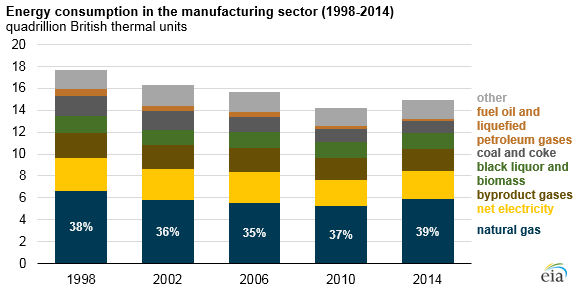
Total energy in manufacturing includes both fuel and nonfuel uses, such as when natural gas is used as a feedstock for chemical manufacturing. Considering fuel use only, natural gas made up a larger share of manufacturing use, while fuels such as coal and coke, fuel oil, and other petroleum liquids made up smaller shares. Natural gas consumption for manufacturing was 5.9 quadrillion British thermal units (Btu) in 2014, or 39% of the total fuel use in manufacturing, compared with 37% in 2010.
On an economic basis, natural gas has become more cost competitive with coal and requires lower expenditures per unit of energy than fuel oil or liquefied petroleum gases.
More information about the manufacturing sector’s use and management of energy is available in EIA’s 2014 Manufacturing Energy Consumption Survey. National and four regional estimates (Northeast, Midwest, South, and West) are provided for 21 industry subsectors, based on the North American Industrial Classification System (NAICS).
Principal contributor: Bob Adler