U.S. electric generating capacity increase in 2016 was largest net change since 2011
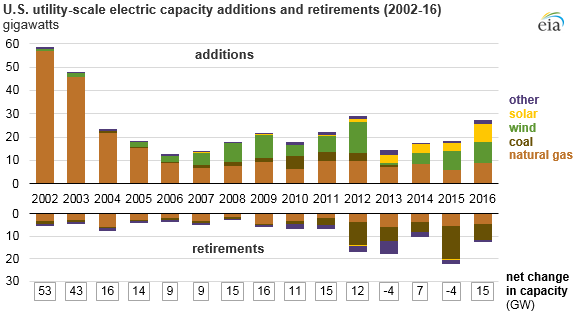
More than 27 gigawatts (GW) of electricity generating capacity was added to the U.S. power grid during 2016, the largest amount of added capacity since 2012. These additions more than offset the retirement of roughly 12 GW of capacity, resulting in a net capacity gain of nearly 15 GW, the largest change since 2011. These net additions follow a 4 GW net capacity decrease in 2015—the largest net drop in capacity recorded in the United States.
The mix of capacity additions has changed considerably in recent years. In the past 15 years, nearly 228 GW of natural gas capacity was added, and from 2002 through 2006, natural gas made up most of the capacity additions in each year. More recently, renewable technologies, primarily wind and solar, have made up a larger share of additions. Of the 2016 total utility-scale capacity additions, more than 60% were wind (8.7 GW) and solar (7.7 GW), compared with 33% (9 GW) from natural gas. Because of differences in the capacity factor across different types of plants, shares of new capacity additions are not typically a good indicator of the shares of generation provided by new capacity across technologies. In addition to varying across generation technologies, new plant capacity factors can also vary significantly across regions.
Large amounts of new utility-scale wind capacity started entering the market in 2007 and have since averaged 7 GW per year, despite occasional lapses in available tax credits. With the exception of 2014, annual utility-scale solar additions have increased in each year since 2008. About 7.7 GW of utility-scale solar was added in 2016—the most ever. The amount of utility-scale solar capacity added in 2016 alone was greater than all utility-scale solar that had been added through 2013. Although not included in the utility-scale additions shown above, another 3.4 GW of distributed solar photovoltaic capacity (i.e., rooftop systems) were added in 2016.
About 20 GW of new coal capacity has been added in the past 15 years, and annual coal additions have been less than 1 GW in each of the previous four years. Watts Bar Unit 2, the first nuclear plant to come online since 1996, added 1 GW of nuclear capacity in 2016.
Since 2002, the electricity industry retired more than 53 GW of coal capacity, most of which were older, smaller, relatively inefficient coal-fired generating units. A nearly equal amount of natural gas-fired capacity (54 GW) retired over the same period, primarily older steam turbines and small gas turbines. Five nuclear plants totaling nearly 5 GW of capacity retired from 2013 through 2016.
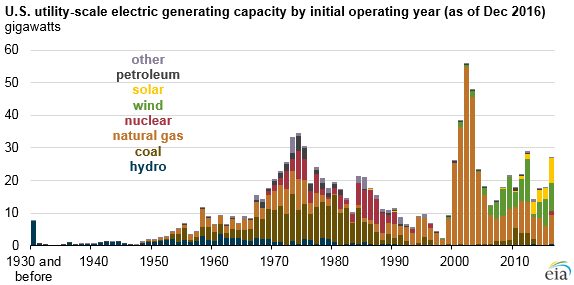
As more plants are retired and new capacity comes online, the distribution of ages of the U.S. generating fleet has changed. Most operating coal plants were built prior to 1980, and a significant portion of U.S. hydroelectric capacity is even older—the oldest hydro plant still operating was built in 1891. Most of the natural gas fleet and almost all wind and solar capacity has been built since 2000.
Principal contributor: Suparna Ray
Tags: capacity, coal, electricity, natural gas, nuclear, solar, wind