
Offshore oil production in deepwater and ultra-deepwater is increasing
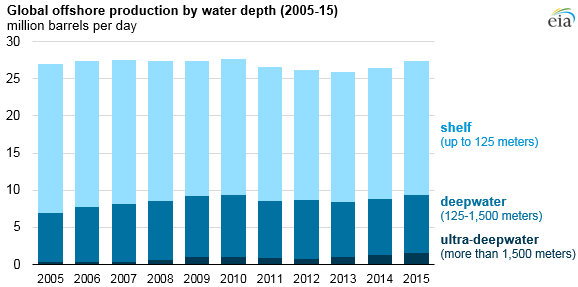
Note: Includes lease condensate and hydrocarbon gas liquids.
Global offshore oil production (including lease condensate and hydrocarbon gas liquids) from deepwater projects reached 9.3 million barrels per day (b/d) in 2015. Deepwater production, or production in water of depths greater than 125 meters, has increased 25% from nearly 7 million b/d a decade ago. Shallow water has been relatively less expensive and less technically challenging for operators to explore and drill, but changing economics and the exhaustion of some shallow offshore resources has helped to push producers to deepwater or, in some areas, ultra-deepwater (at depths of 1,500 meters or more) resources. The share of offshore production from shallow water in 2015 was 64%, the lowest on record.
Globally, offshore oil production accounted for about 30% of total oil production over the past decade. In 2015, offshore production was 29% of total global production, a moderate decrease from 32% in 2005.
Advancements in drilling technology, dynamic positioning equipment, and floating production and drilling units have made prospects viable that were previously unreachable. Although technological advancements have made new areas accessible, deepwater projects require more investment and time compared to shallow waters or onshore developments. As a result, most nations with offshore assets operate only in shallow water.
In areas with deepwater operations, production has grown significantly, and in many cases overtaken shallow-water production. The majority of deepwater or ultra-deepwater production occurs in four countries: Brazil, the United States, Angola, and Norway. Each of these countries has realized an increasing share of crude oil production from deepwater or ultra-deepwater projects over the previous decade. The United States and Brazil together account for more than 90% of global ultra-deepwater production, with ultra-deepwater production expected to increase in 2016 and 2017 in both countries.
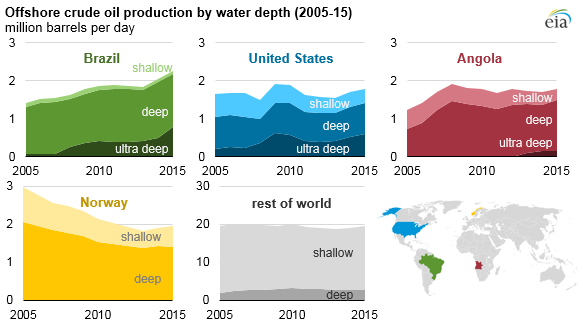
Note: Includes lease condensate and hydrocarbon gas liquids.
Brazil leads the world in the development of deepwater and ultra-deepwater projects. Brazil has increased deep and or ultra-deepwater production from 1.3 million b/d in 2005 to 2.2 million b/d in 2015. An increasing amount of Brazil’s production comes from presalt resources found under thick layers of salt at extreme depths. The coast of Angola shares similar geologic features with the coast of Brazil because of the separation of the African and South American tectonic plates during the Early Cretaceous period, around 150 million years ago. These geological similarities have led producers in Angola to target several major basins for presalt exploration.
Principal contributor: Matthew Manning
Tags: Brazil, liquid fuels, Norway, offshore, oil/petroleum, production/supply