Future natural gas plant liquids production depends on resources, market conditions
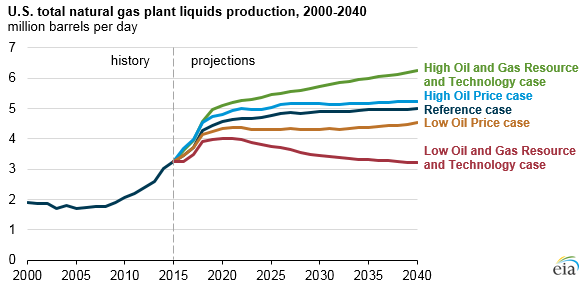
Natural gas plant liquids (NGPL) accounted for 22% of total U.S. petroleum and other liquid fuels production in 2015. In EIA's Annual Energy Outlook 2016 (AEO2016) Reference case, increases in NGPL account for a significant share of total increases in petroleum and other liquid fuels production over 2015–40. Because NGPL can be recovered from natural gas production streams or in association with crude oil production, future NGPL production depends on assumptions concerning the abundance of crude oil and natural gas resources and on the price differential between oil and natural gas.
AEO2016 includes alternative cases that reflect these implications for U.S. NGPL production. In addition to the Reference case, the AEO2016 side cases include studies of the effects of higher or lower oil prices and higher or lower resource and technology assumptions. By 2030, the Brent crude oil spot price averages $49 per barrel (b) in the Low Oil Price case, $104/b in the Reference case, and $207/b in the High Oil Price case.
The Resource and Technology cases produce the widest range of NGPL production and are principally defined by assumptions about the estimated ultimate recovery for shale gas, tight gas, and tight oil wells in the Lower 48 states, undiscovered resources in Alaska, and the offshore Lower 48 states. In the High and Low Oil and Gas Resource and Technology cases, these recovery rates are 50% higher or 50% lower, respectively, than in the Reference case. Rates of technological improvement that reduce costs and increase productivity in the United States are also 50% higher or 50% lower than in the Reference case. The higher case also includes production from shale resources (a resource type often containing high levels of NGPL) not discovered in the other cases, where more limited exploration occurred.
Because NGPL is produced during the processing of natural gas, either from natural gas wells or from gas associated with crude oil production, NGPL production levels are largely driven by the development of these resources. The revenue associated from extracting NGPL streams, such as ethane, propane, butane, and natural gasoline, justify the cost of producing areas with NGPL-rich resources. When the price ratio between crude oil and natural gas is high, a producer is more likely to develop higher NGPL recovery formations because they can overcome the higher cost of processing these resources. When the spread is narrow, a producer is likely to avoid these costs and focus on developing natural gas production areas with low or no NGPL.
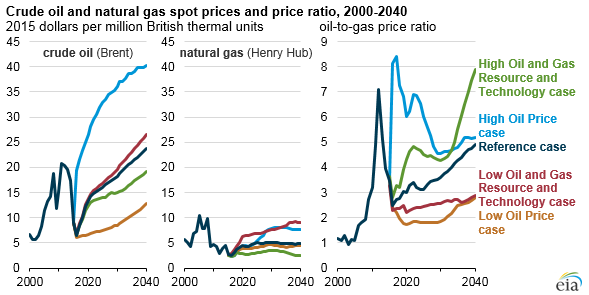
Oil-to-gas price ratios are initially highest in the High Oil Price case, and, later in the projection period, in the High Oil and Gas Resource and Technology case. In these cases, NGPL production increases above Reference case levels. By 2040, NGPL production reaches 6.2 million b/d in the High Oil and Gas Resource case and 5.3 million b/d in the High Oil Price case, compared to 5.0 million b/d in the Reference case.
NGPL is used both domestically and abroad. Since 2012, when NGPL production started to increase, the United States has built extensive capacity to use or export NGPL. Operators of petrochemical plants, which use NGPL to produce olefins for use in finished products like plastics, have announced plans to expand their facilities to take advantage of the rising availability of NGPL as a feedstock.
Additional analysis on NGPL production is available in an Issues in Focus article as part of AEO2016.
Principal contributor: Warren Wilczewski, Bill Brown