
Pipelines, tankers, and barges convey transportation fuels from Gulf Coast to East Coast
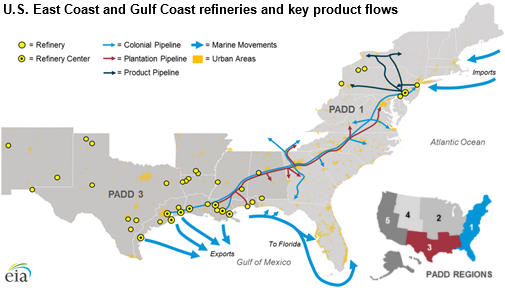
Note: Click to enlarge. PADDs are Petroleum Administration for Defense Districts.
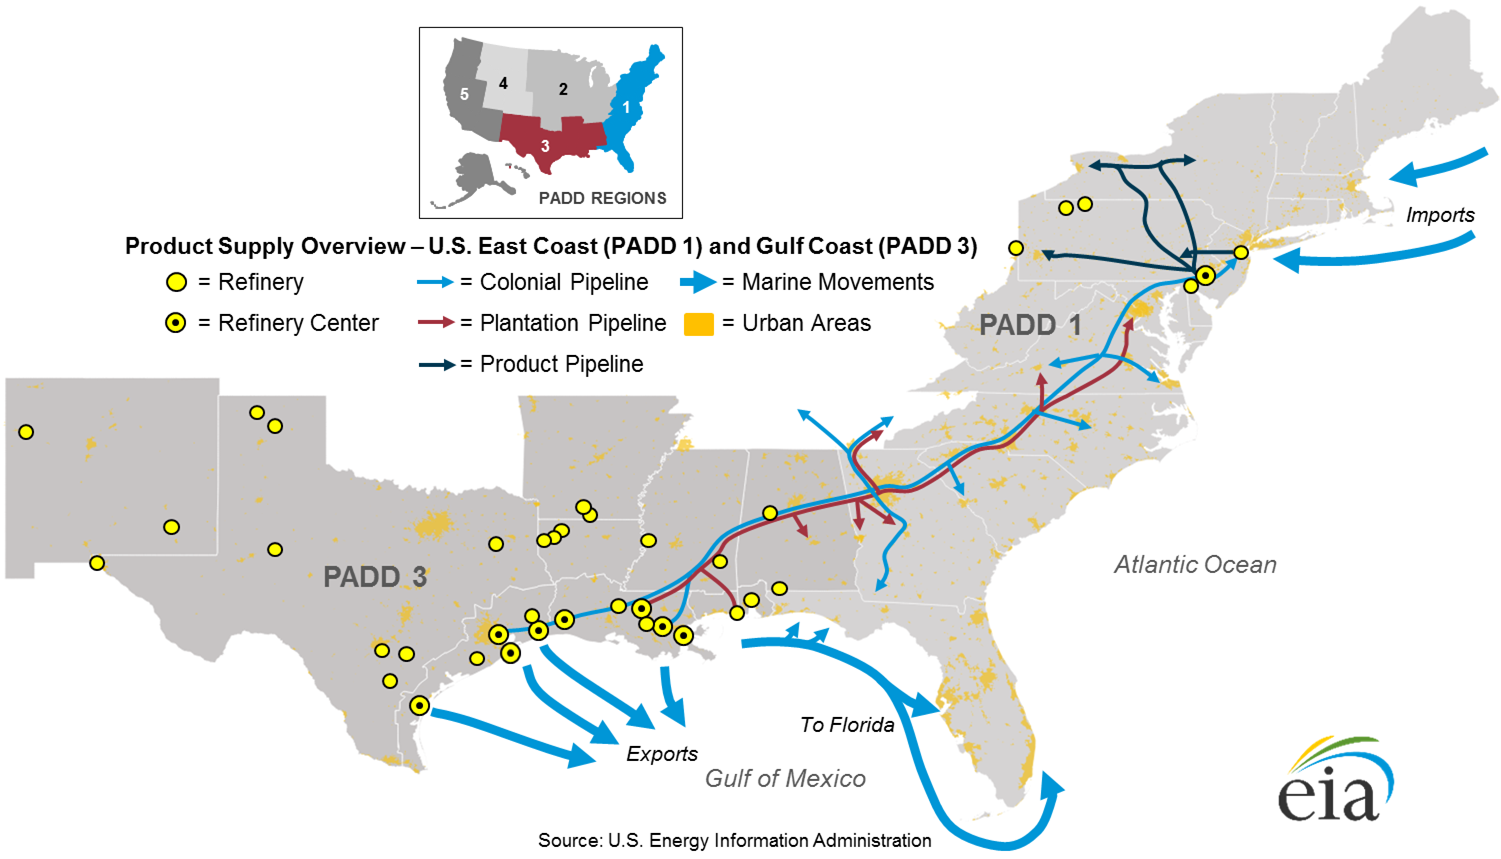
In the United States, the East Coast and Gulf Coast are highly dependent on each other to balance supply and consumption of transportation fuels (mainly gasoline, diesel, and jet fuel). East Coast transportation fuels consumption is met through a number of supply sources, but none is more important than supply from the Gulf Coast. Conversely, surplus supply in the Gulf Coast is distributed to a number of domestic and foreign markets, but none is larger than the East Coast.
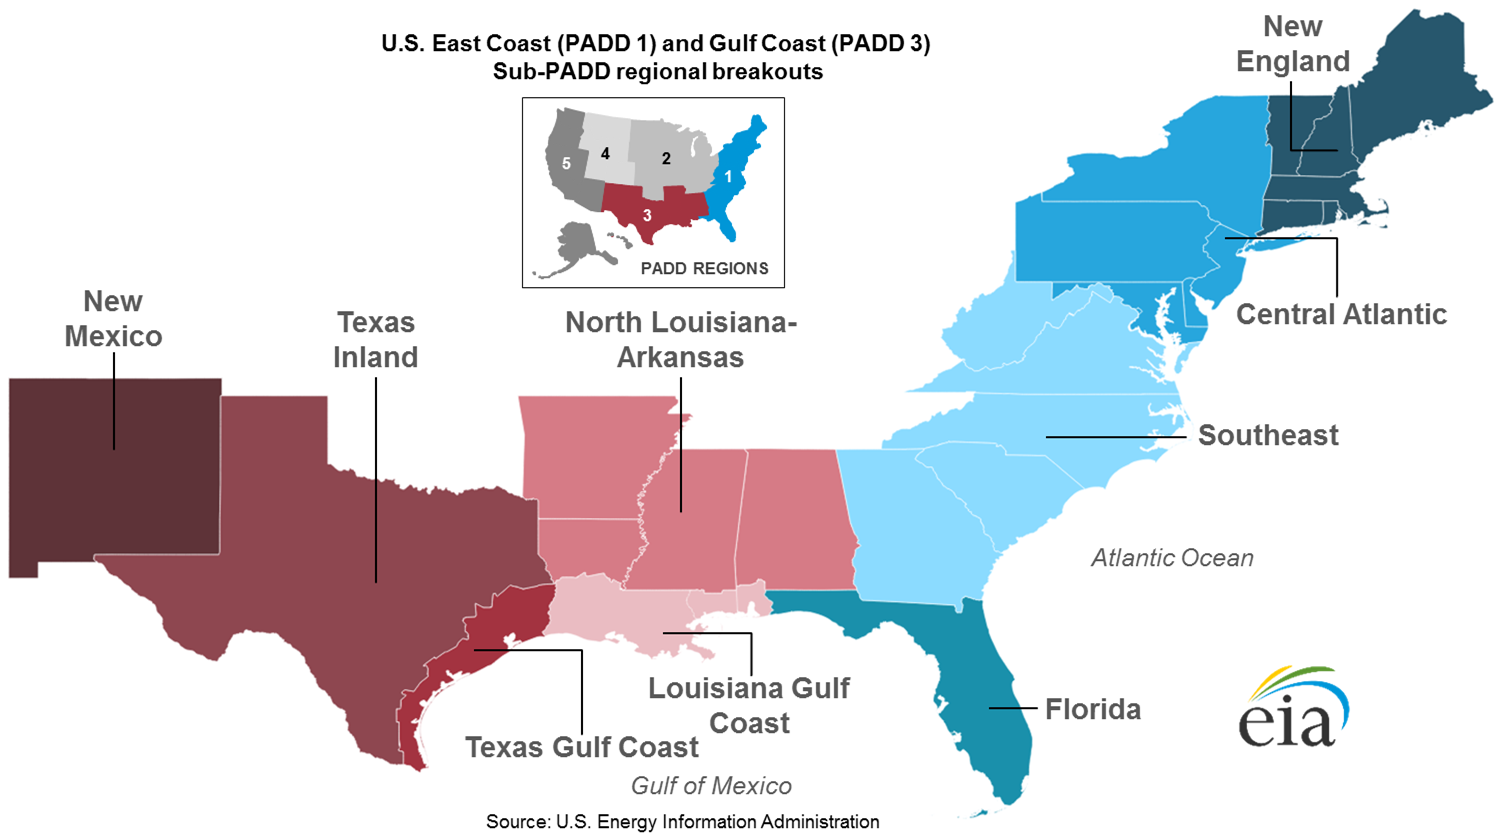
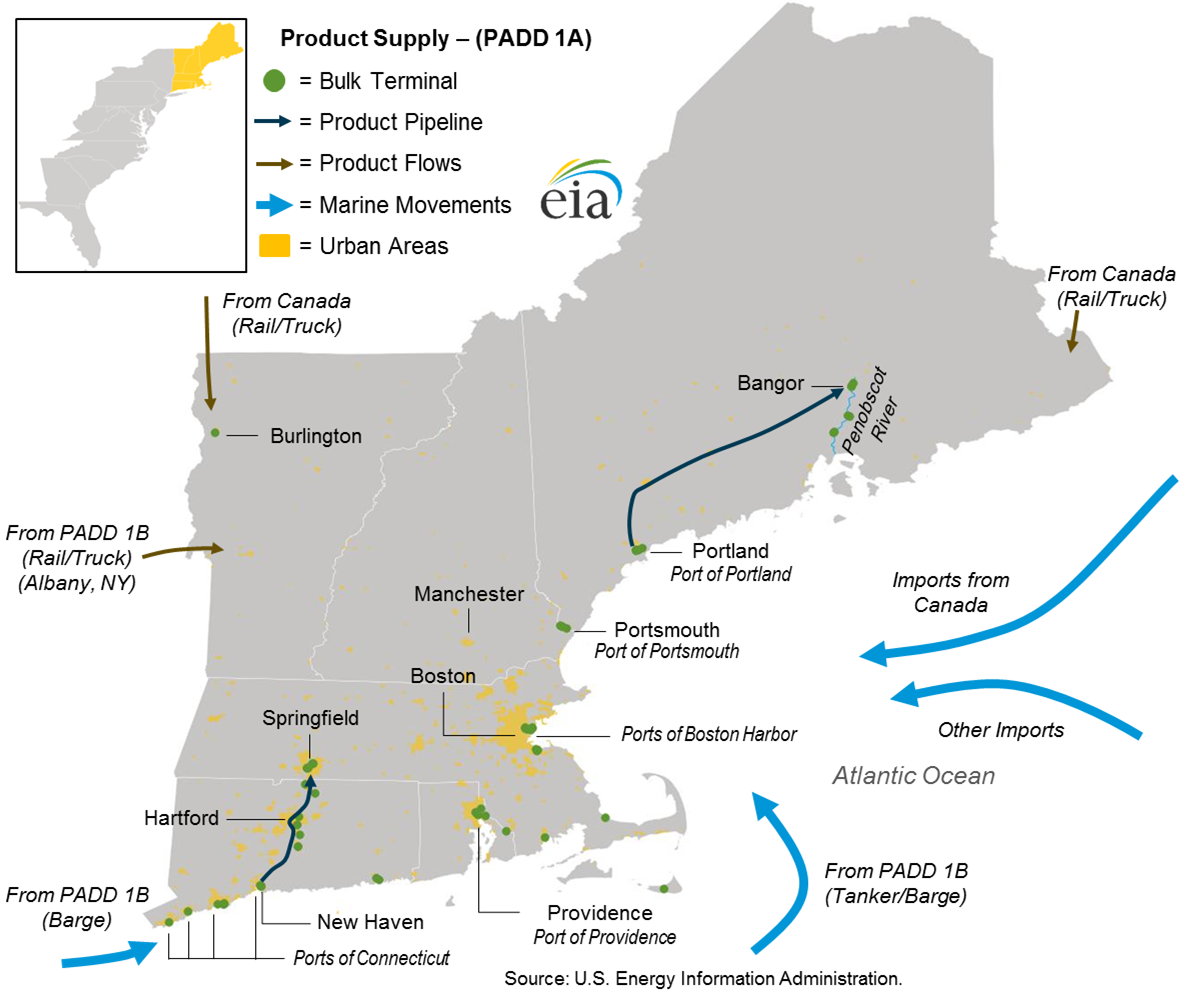
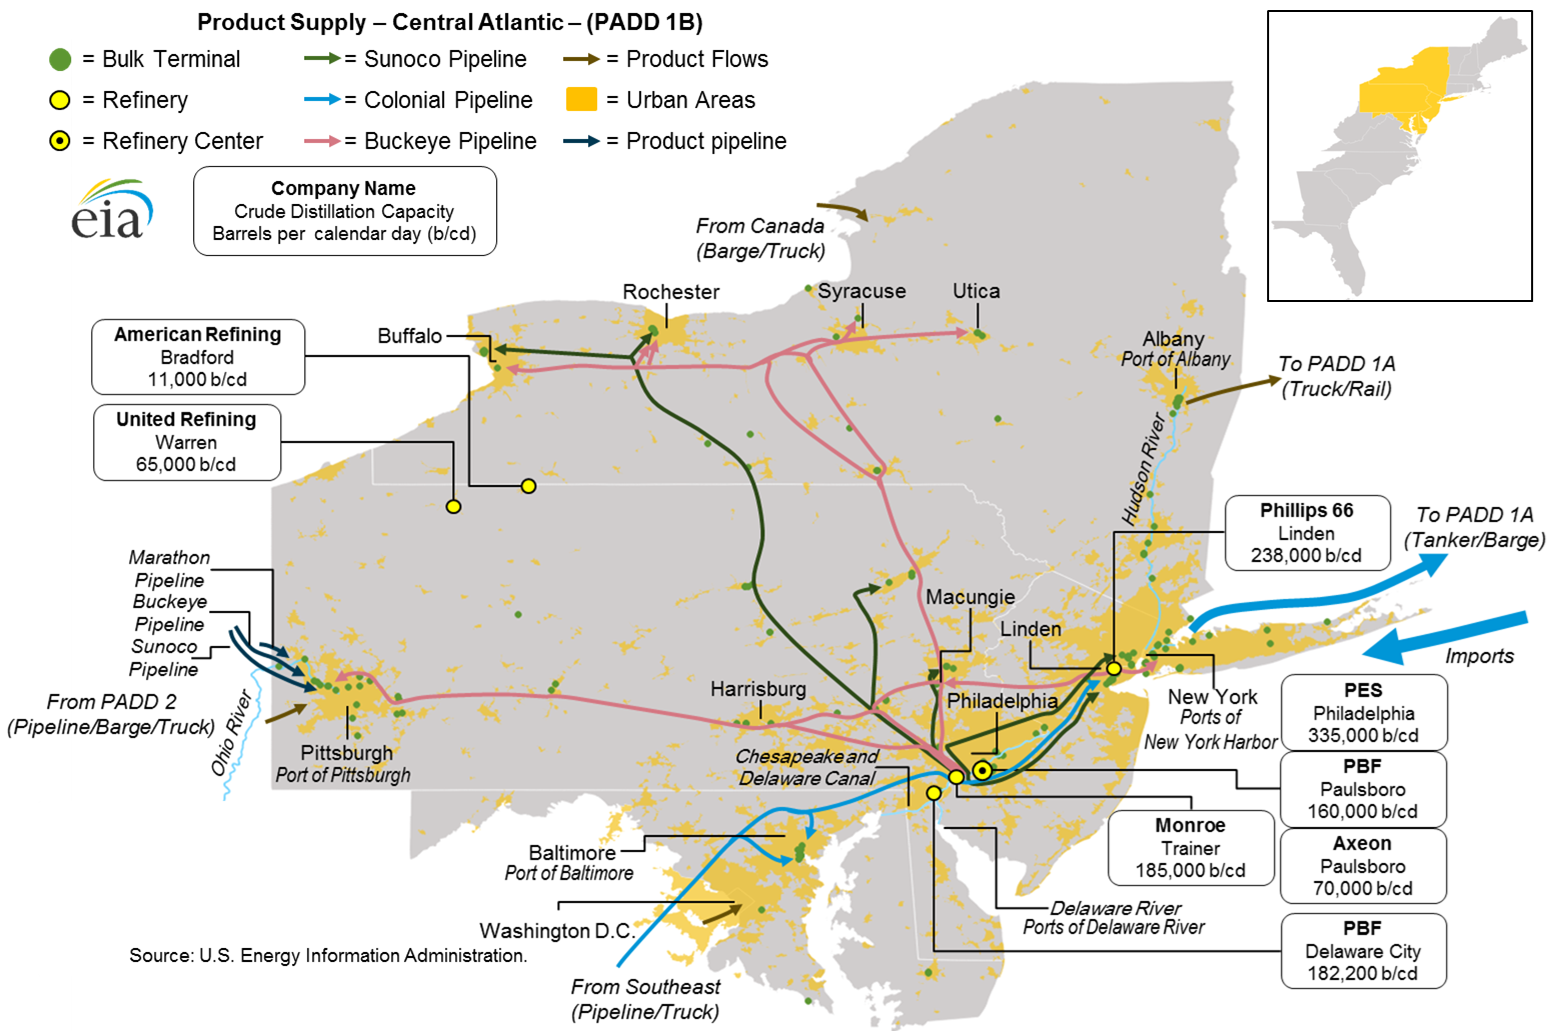
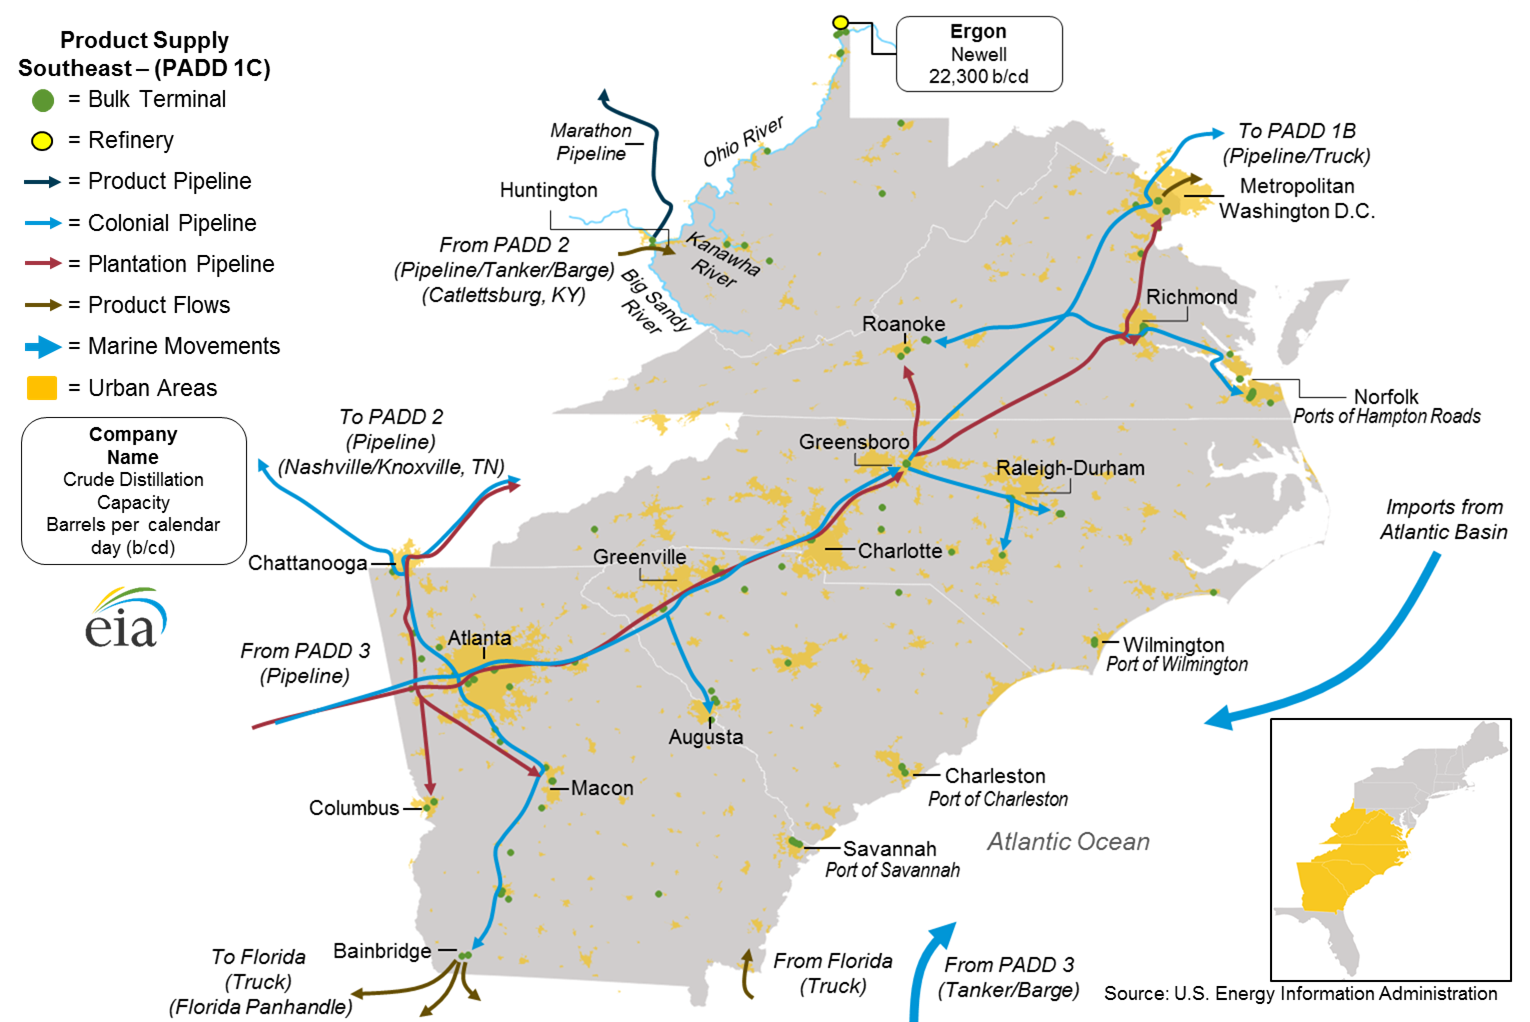
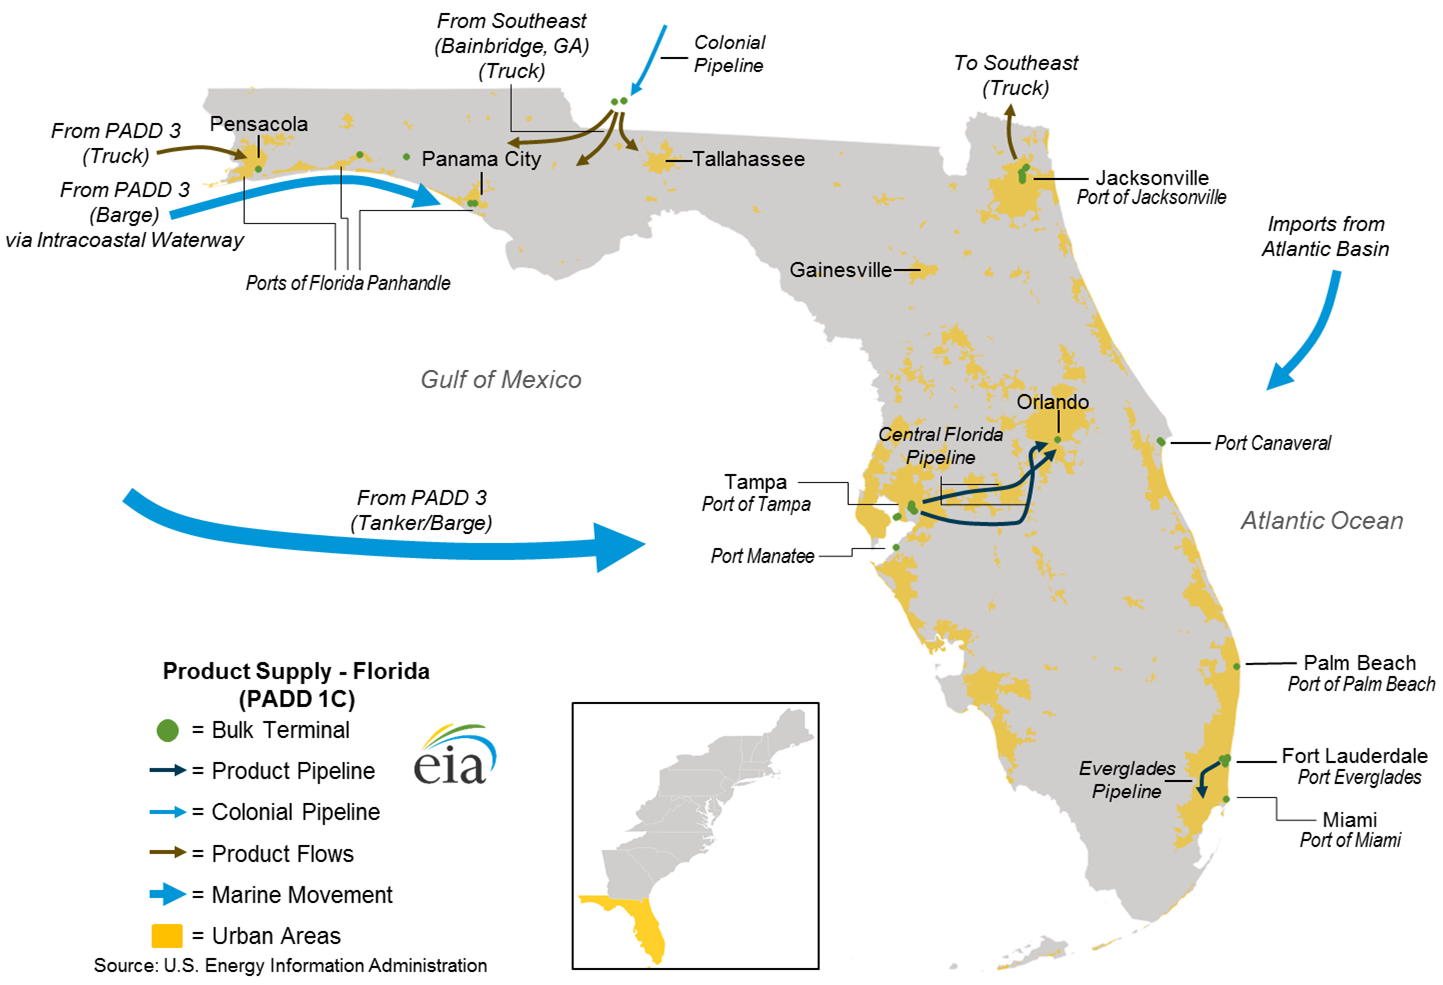
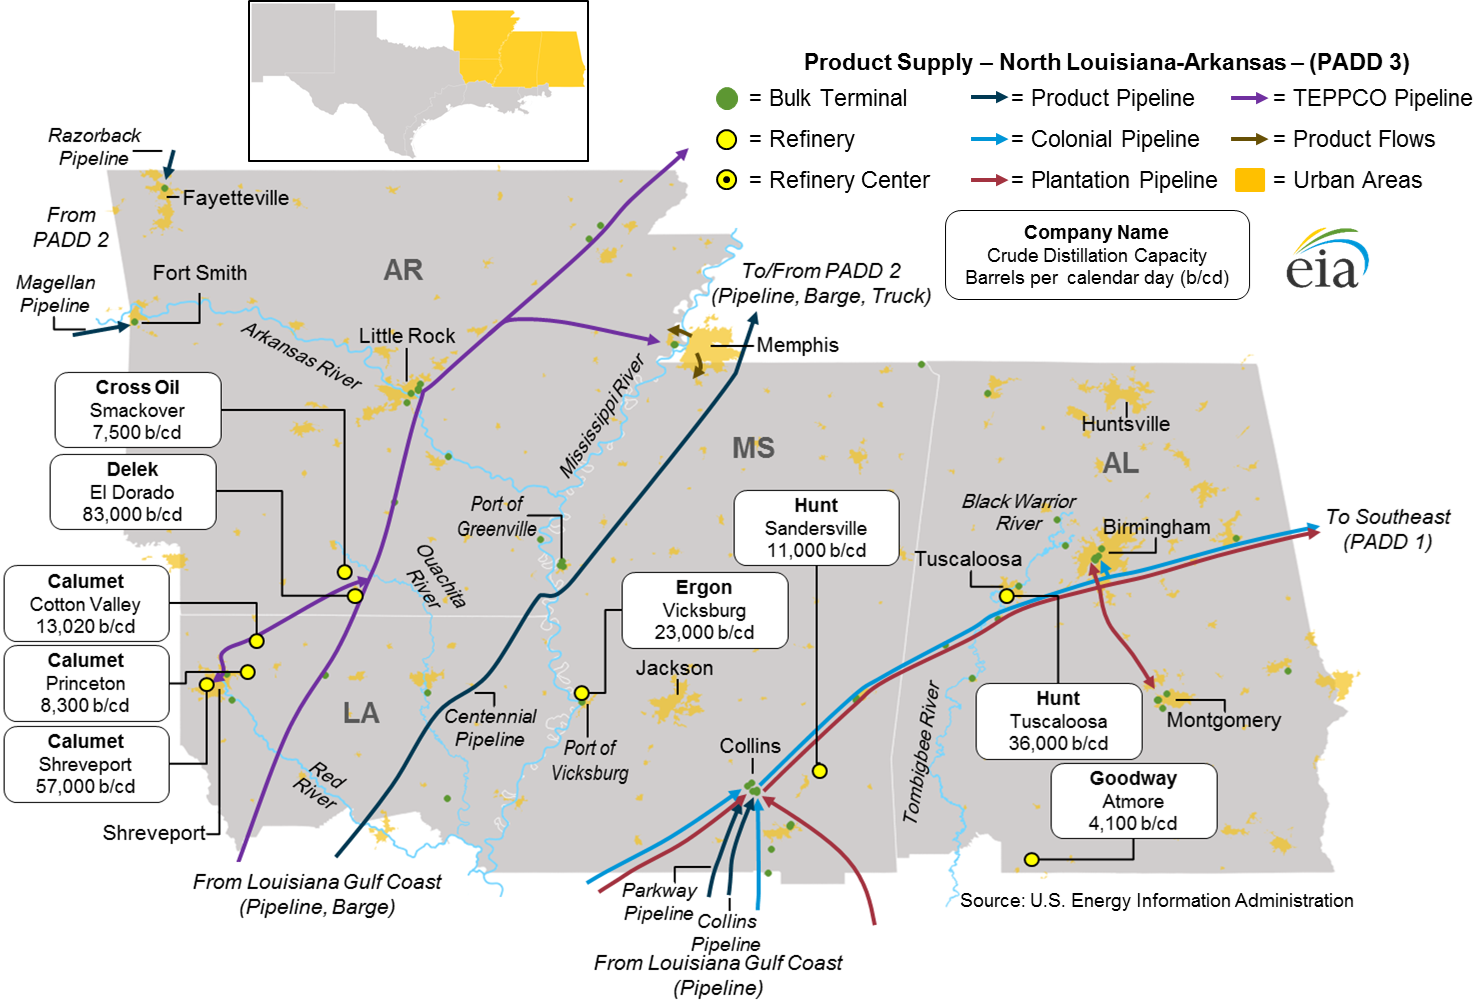
EIA has commissioned studies of transportation fuels supply, consumption, and distribution in certain regions of the country, as defined by Petroleum Administration for Defense Districts (PADDs). The most recent study involves the East Coast and Gulf Coast regions and nine sub-PADD regions: four in the East Coast and five in the Gulf Coast.
 |
 |
 |
 |
 |
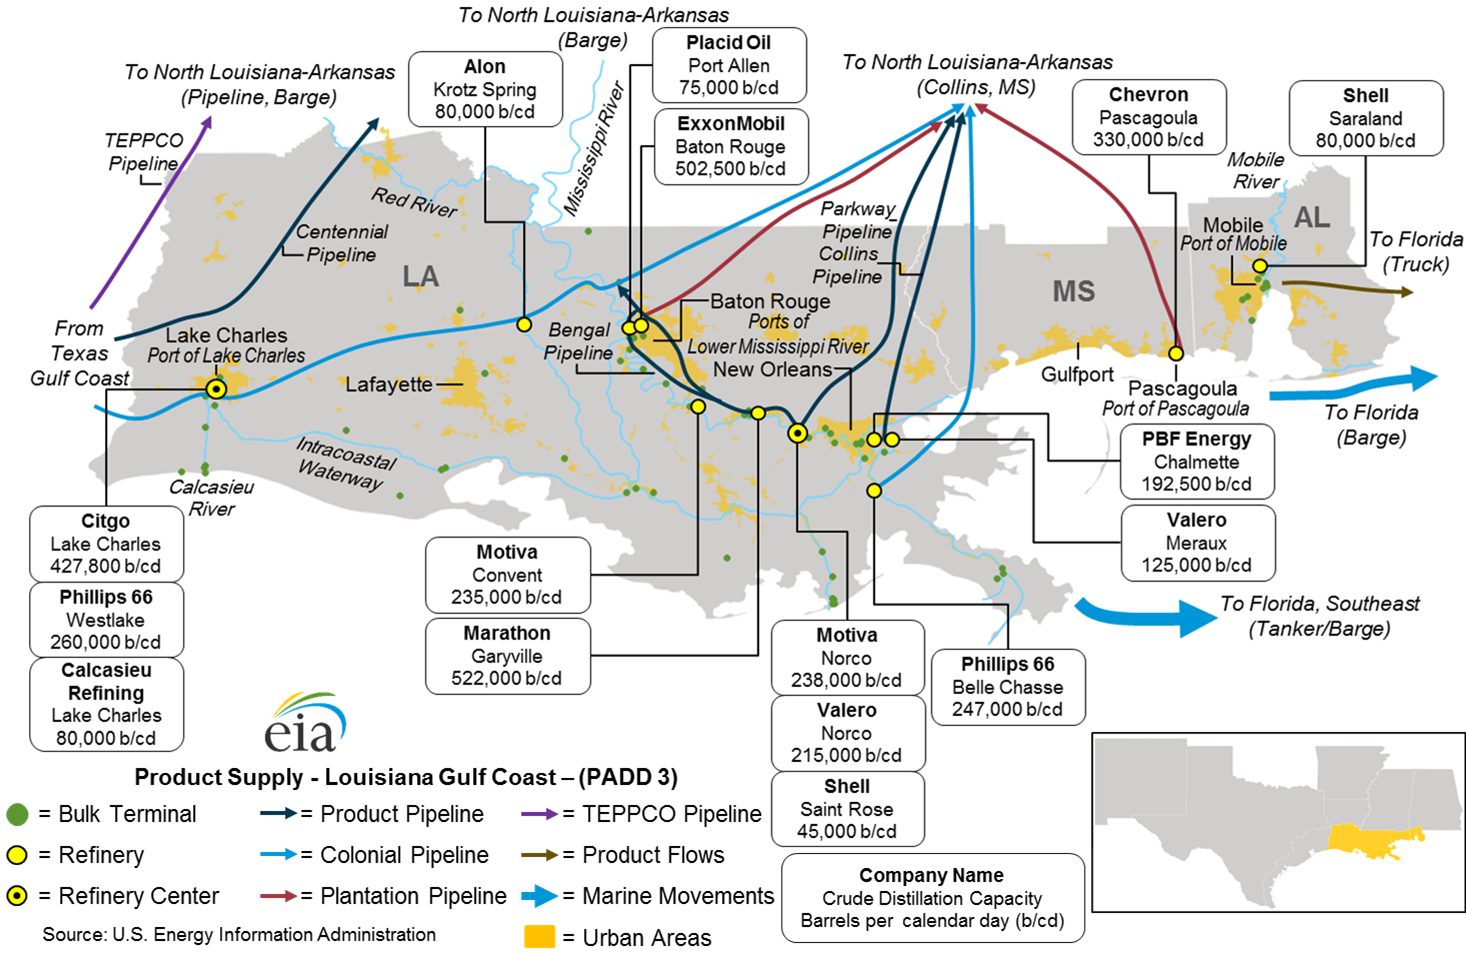 |
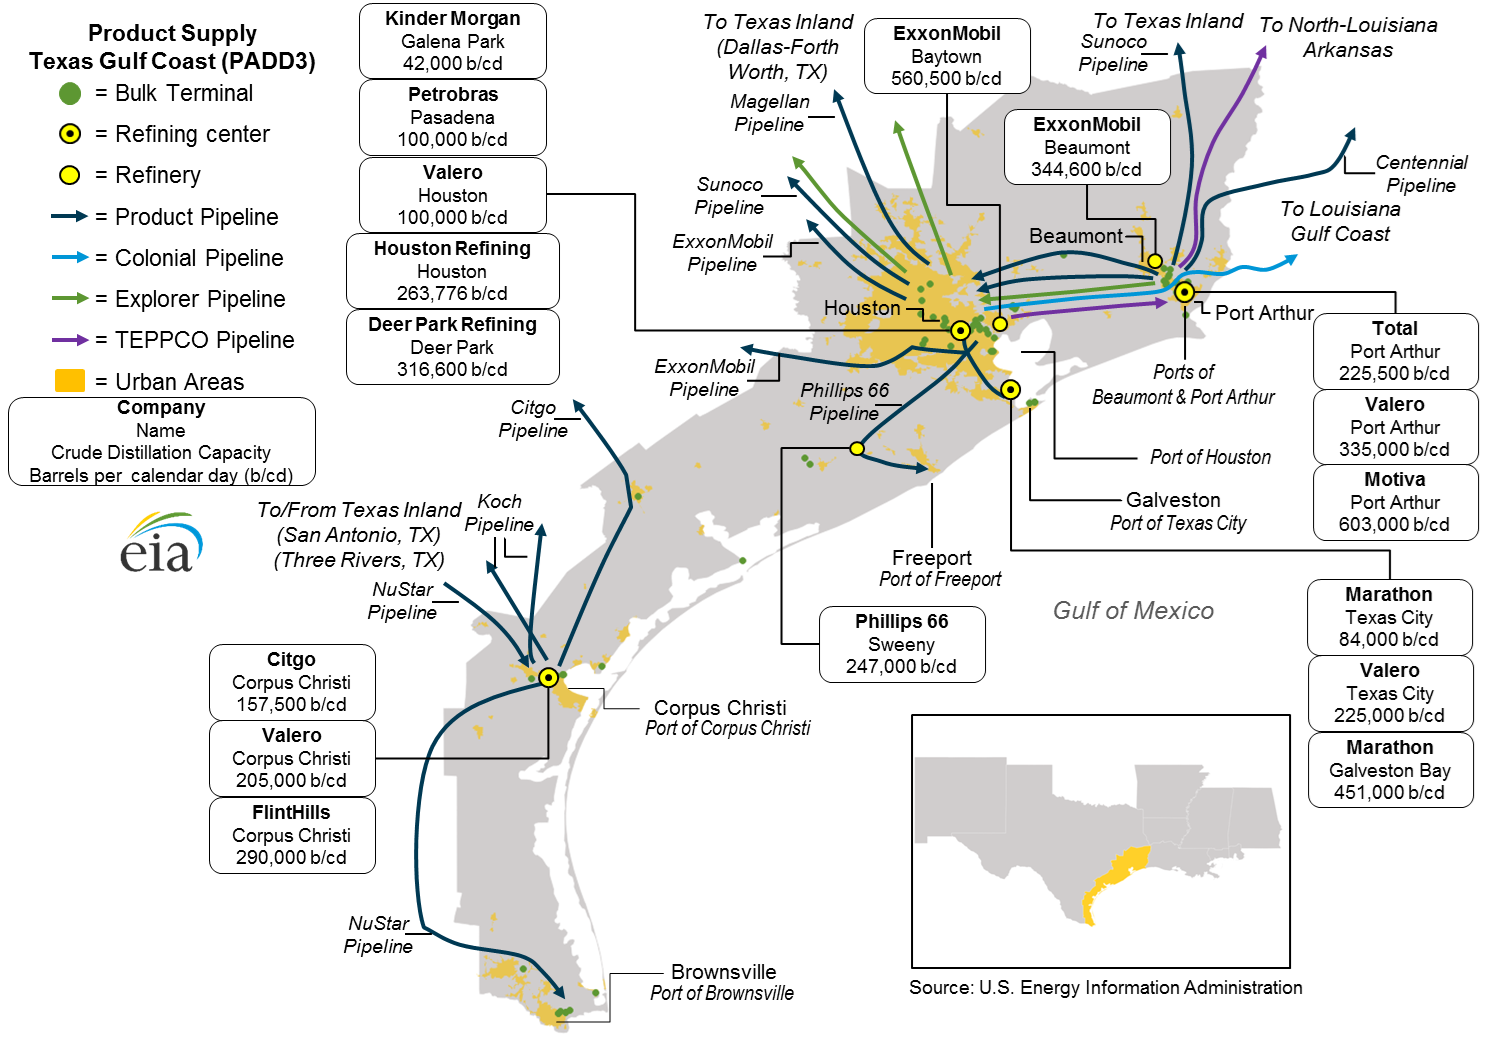 |
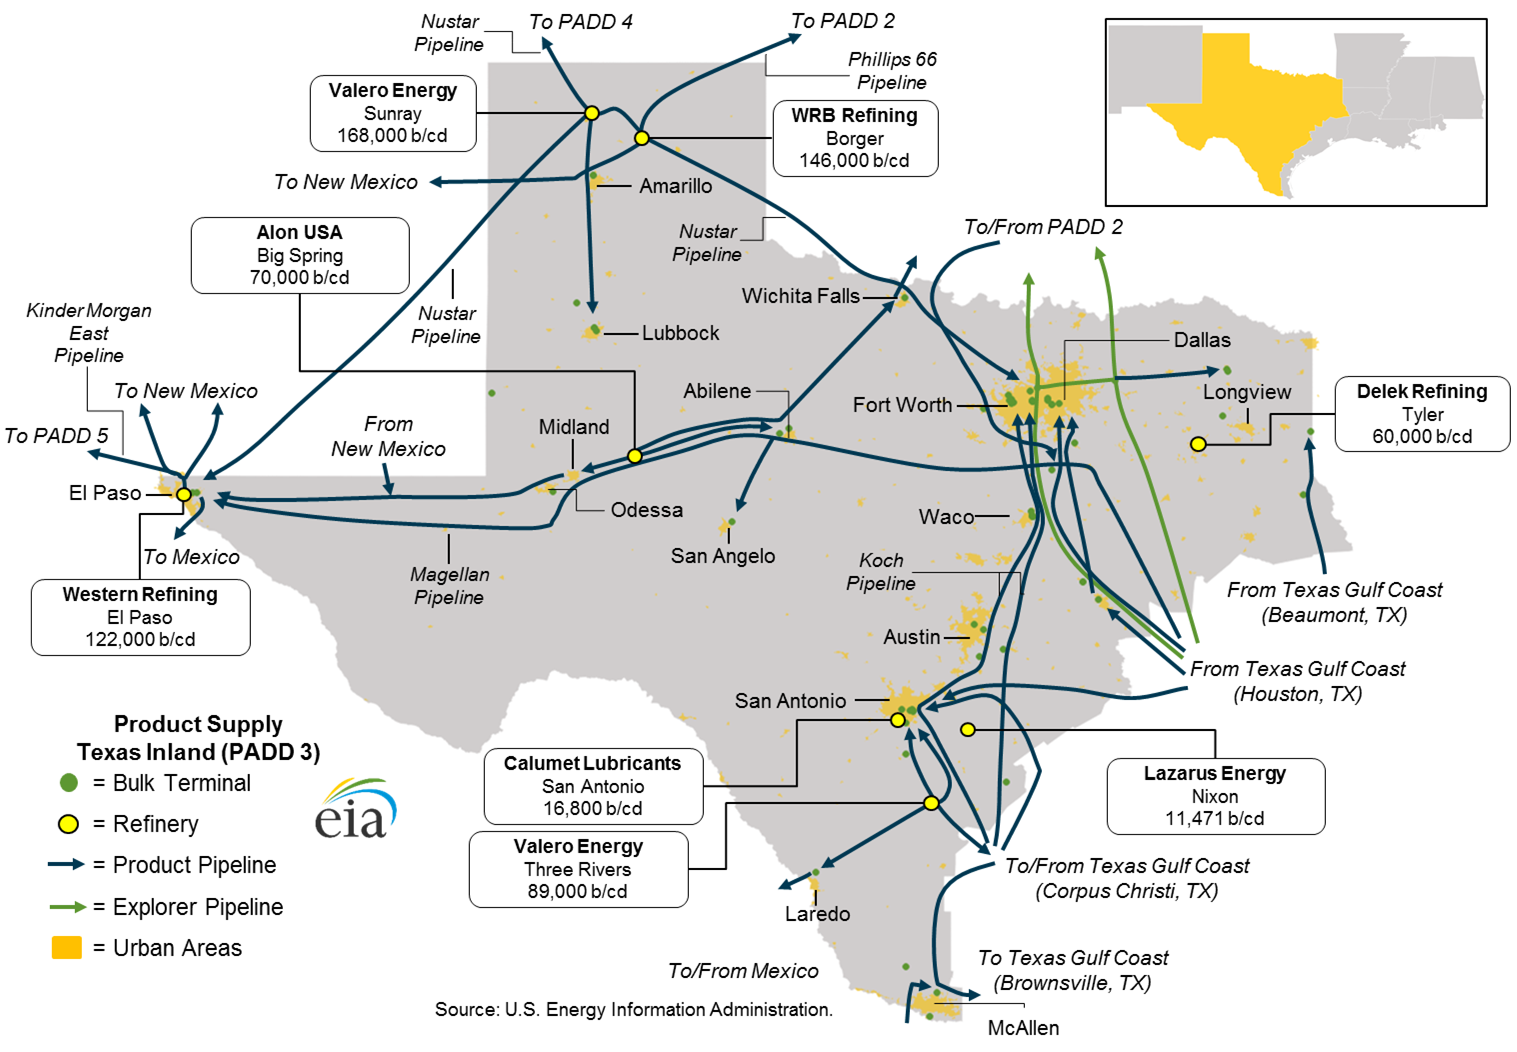 |
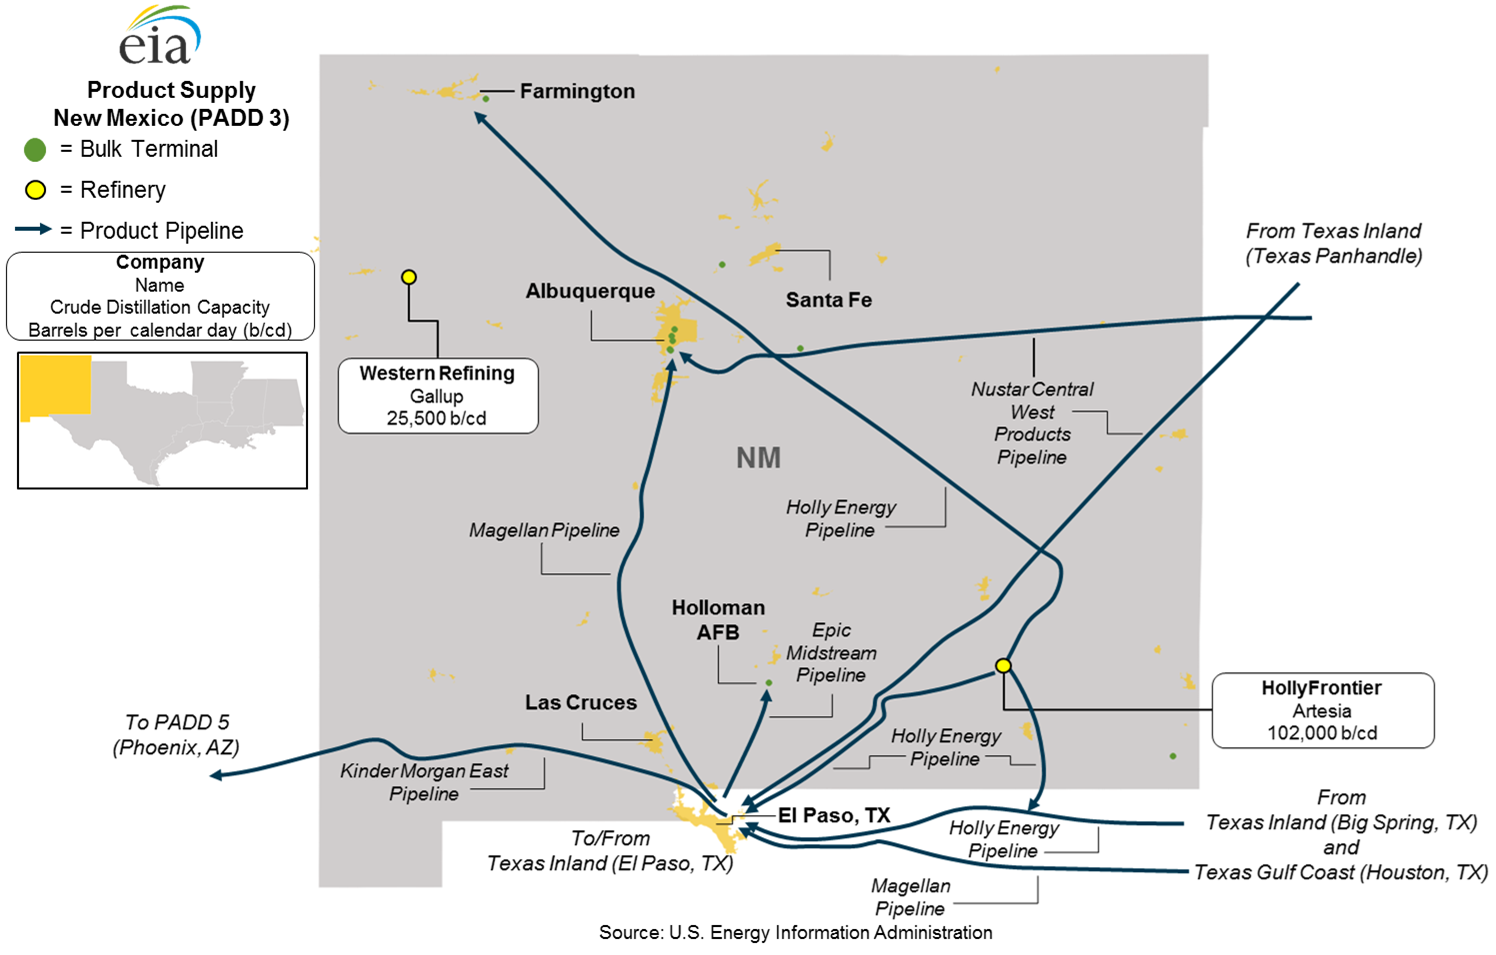 |
Note: PADDs are Petroleum Administration for Defense Districts. Sub-PADD regional breakouts were used in the analysis.
Two pipelines, the Colonial Pipeline and the Plantation Pipeline, typically operate at or near full capacity and in 2014 moved approximately 2.3 million barrels per day (b/d) of transportation fuels from the Gulf Coast to the East Coast. The Colonial system consists of 5,500 pipeline-miles and has connections to 29 refineries and 267 customer terminals. The Plantation system consists of 3,100 pipeline-miles and 36 pumping stations and has connections to 90 terminals at 34 delivery locations.
An additional 0.5 million b/d of transportation fuel is shipped from the Gulf Coast to the East Coast by coastwise-compliant tankers and barges, primarily to ports in Florida. Together, net pipeline and waterborne shipments from the Gulf Coast to delivery points in the East Coast are equal to 58% of East Coast consumption and 37% of Gulf Coast supply.
Waterborne movements—both coastwise and internal river movements—connect supply and consumption centers between and within the Gulf Coast and East Coast regions. The Gulf Coast region, particularly the areas of Texas and Louisiana near the coast, is characterized by large outbound shipments of products primarily delivered to markets in the East Coast (especially Florida) and to export destinations, but also to coastal and riverine markets in other areas of the Gulf Coast as well as the Midwest.
More information on East Coast and Gulf Coast transportation fuels markets is available in PADDs 1 and 3 Transportation Fuels Markets. An earlier study evaluated transportation fuel markets in the Pacific Coast region (PADD 5).
Principal contributors: Mason Hamilton, Hannah Breul